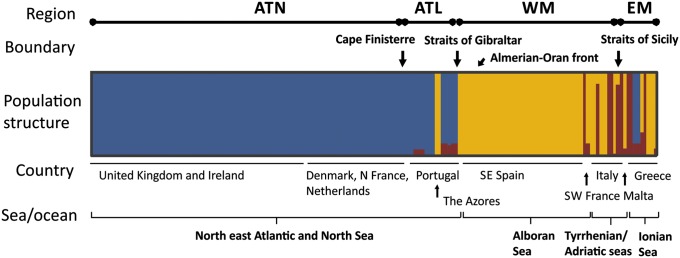
Fig. 4.
Structure plot for K = three model clusters for samples of O. marina. Each isolate of O. marina is depicted by a vertical line that is partitioned into K colored sections (colors as in Fig. 1). The length of each section is proportional to the estimated membership coefficient (Qind) of each cluster. Clusters are synonymous with clades (Fig.1): cluster 1 (blue) is equivalent to clade 1, cluster 2a (yellow) is equivalent to clade 2a, and cluster 2b (red) is equivalent to clade 2b.

