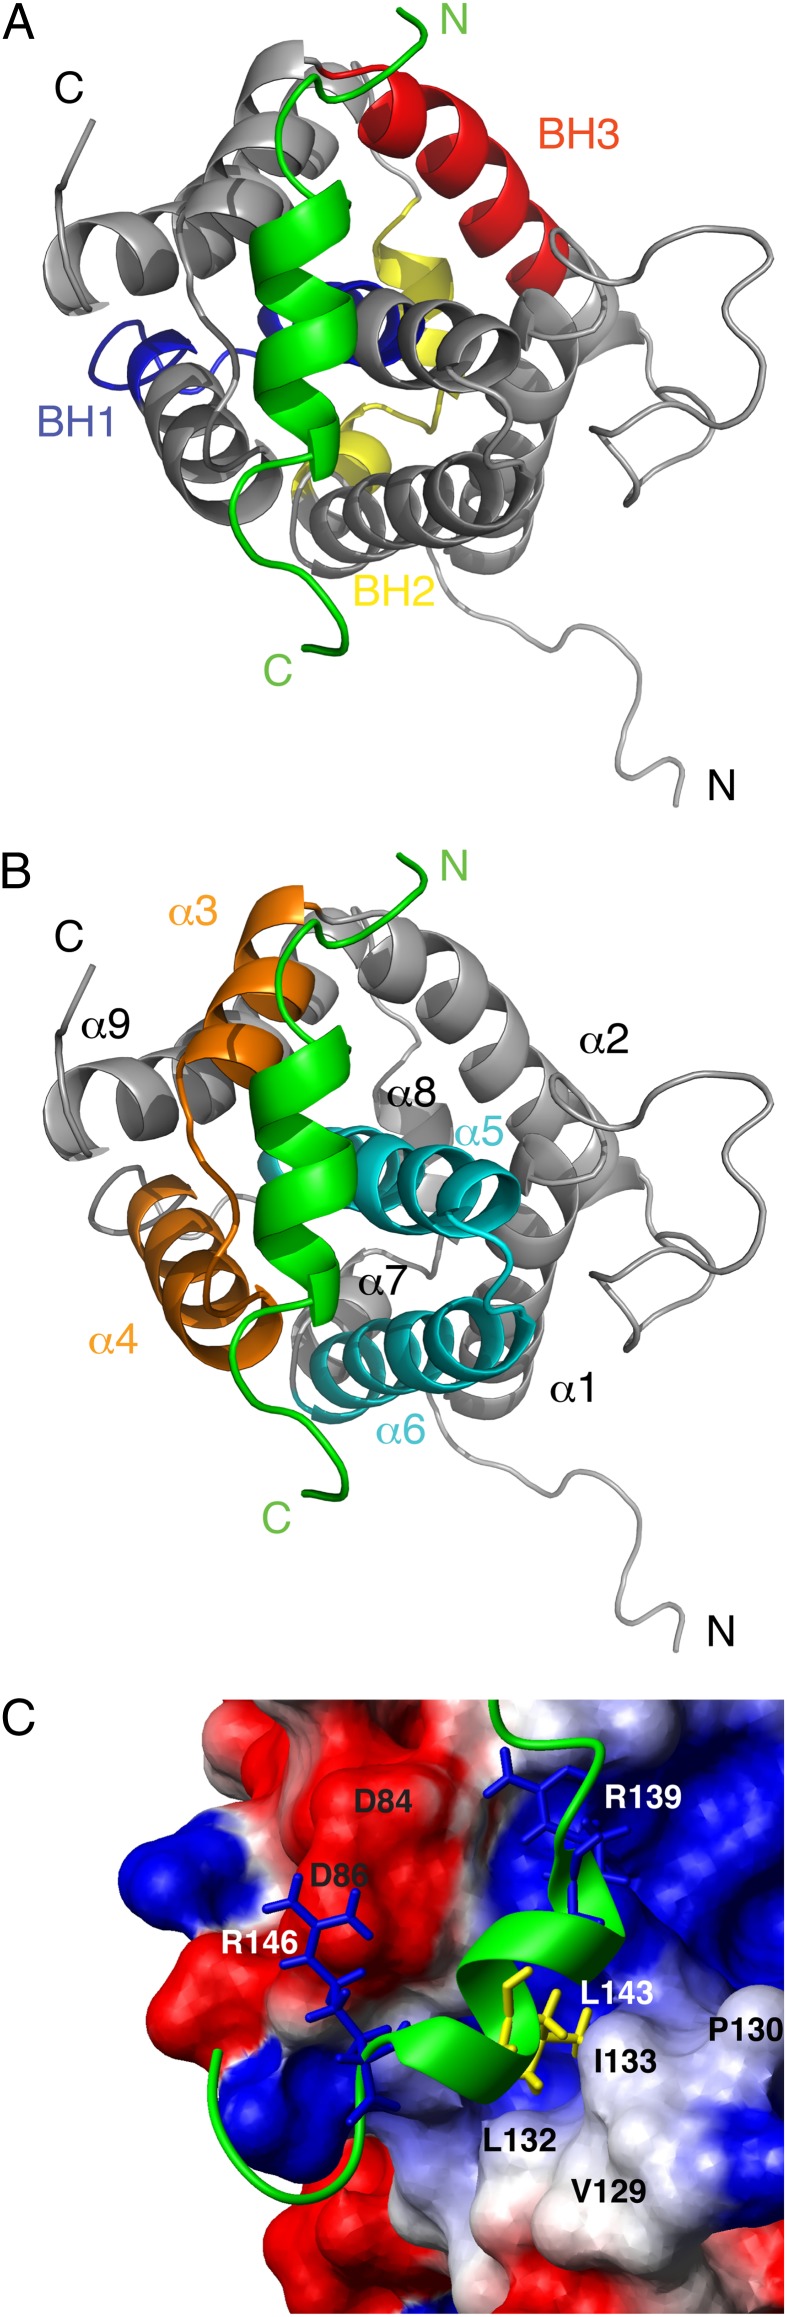
Fig. 3.
Bax–vMIA-BBD complex. (A and B) Ribbon display of a representative structure of the complex, with vMIA-BBD colored green. The N and C termini are indicated. (A) BH domains of Bax are indicated. (B) Helices of Bax are indicated, with the α3/α4 and α5/α6 hairpins highlighted in orange and cyan, respectively. (C) Close-up view of the binding pocket, where Bax is shown in a surface representation with positive (blue) and negative (red) charges indicated, as well as the position of selected residues (black labels). vMIA-BBD is shown as a green ribbon, with selected side chains (white labels) displayed in stick representation.

