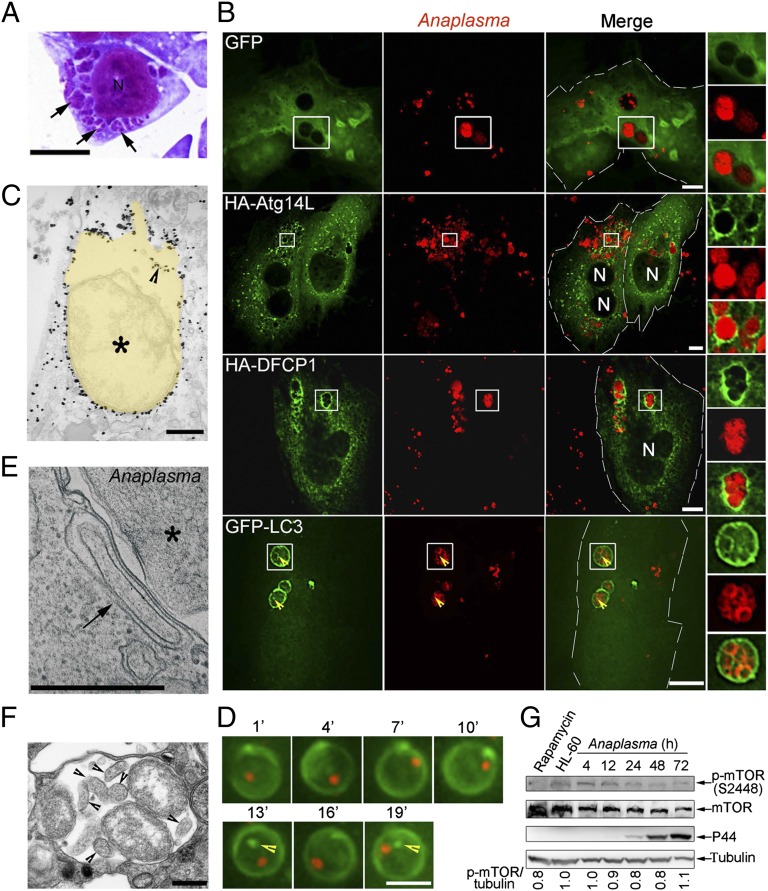
Fig. 4.
Autophagy proteins localize to Ap inclusions. (A) Ap-infected cells at 2 d postinfection (p.i.). Ap morulae/inclusions are indicated with arrows in Diff-Quik staining. N, nucleus. (Scale bar: 5 μm.) (B) Ap-infected RF/6A cells expressing GFP, HA-Atg14L, HA-DFCP1, or GFP-LC3 were immunostained with anti-Ap and anti-HA at 2 d p.i. N, nucleus. Boxed areas are magnified on the right. (Scale bars: 10 μm.) Arrowheads indicate the presence of GFP-LC3 inside of Ap inclusions. (C) Immunogold labeling for GFP-LC3 in Ap-infected GFP-LC3–expressing RF/6A cells. Yellow pseudocolored area, Ap inclusion. An arrowhead indicates the GFP-LC3 inside of Ap inclusion. An asterisk indicates Ap. (D) Selected sequential video images of a single inclusion containing an mCherry-Ap (red) in live RF/6A cells transfected with plasmid encoding GFP-LC3 (green). GFP-LC3 puncta inside of Ap inclusion are indicated with arrowheads. (Scale bar, 4 μm.) (E) An autophagosome (arrow) is closely apposed to the Ap (asterisk) inclusion membrane in HL-60 cells. (F) An Ap inclusion containing autophagic bodies (arrowheads). Note that the content of autophagic vesicles is similar to the host cell cytoplasm. (C, E, and F) TEM. (Scale bars: 0.5 μm.) (G) Phosphorylated mTOR level in Ap-infected HL-60 cells harvested at 4, 12, 24, 48, and 72 h p.i. Western blot analysis using antibodies against α-tubulin, mTOR, and p-mTOR. HL-60, uninfected HL-60 cells. Rapamycin-treated HL-60 cells were used as positive control. The values under the bands show the relative ratios of band intensities of p-mTOR to tubulin, with the ratio in HL-60 lane set as one.

