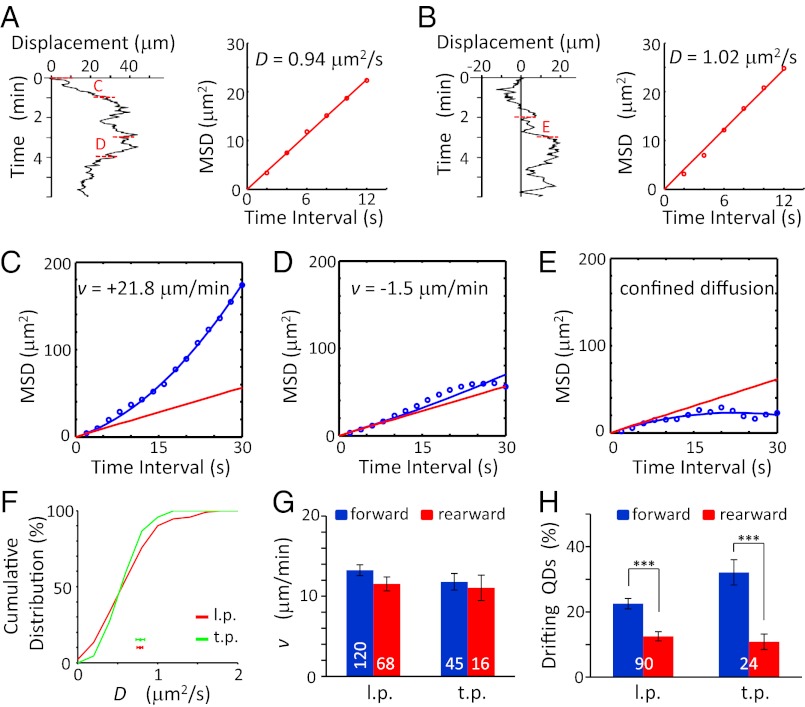
Fig. 2.
Quantitative analysis of surface VAMP2-QDs movements on migrating granule cells. (A and B) (Left) Neurolucida traces of the QD movements shown in Fig. 1 A and B, respectively. (Right) The D value was determined by using the first six data points of the MSD-vs.-time plot, averaged for all starting locations of QDs covered by the trajectory during the 6-min period. The segments marked “C” and “D” in panel A and “E” in panel B represent 60-s segments of the trajectory that were used to calculate the v value. (C–E) The v value was determined by the first 15 points of the MSD vs. the t curve of the 60-s segment. The red line represents the pure diffusion using the D value above, and the blue line represents the best fit of MSD = 2Dt + (vt)2. (F) Cumulative percentage for the distribution of D values. Data points below depict the mean value of D (± SEM) observed for QDs on the l.p. (red trace; n = 90 from 45 cells) t.p. (green trace, n = 24 from 13 cells). The difference between the two curves was not significant [P = 0.75, Kolmogorov–Smirnov (K-S) test]. (G) The mean value of v (± SEM) in migrating cells in the forward (blue) and rearward (red) directions along the l.p. and t.p. The difference was not significant (P > 0.12, t test). (H) The percentage of QDs showing drift in the forward (blue) and rearward (red) directions along the l.p. and t.p. (P < 0.0003, paired t test). Only the percentages of QDs showing drift movement are shown here. The numbers associated with the bars represent the total number of QDs examined. ***P < 0.001. Error bars indicate SEM.

