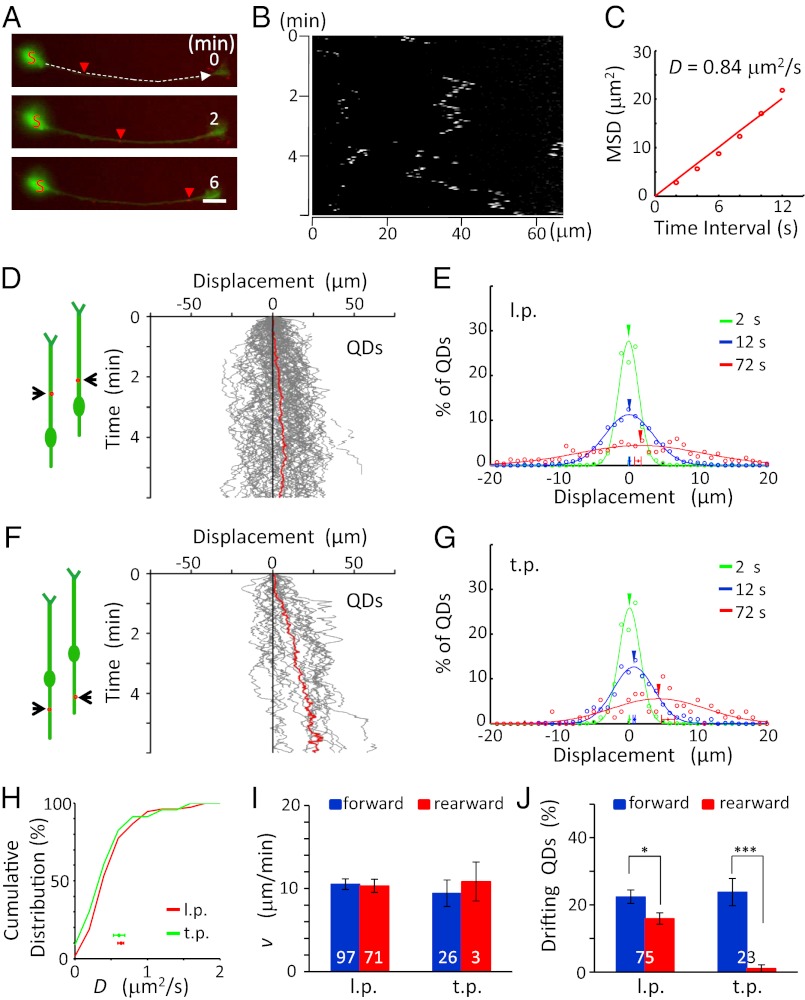
Fig. 4.
Forward transport of surface TrkB-QD in migrating granule cells. (A and B) An example of the surface movement of a TrkB-QD on the l.p. of a migrating granule cell (A) and its kymograph (B). Red arrowheads indicate positions of the same QD at different time points. (Scale bar, 10 μm.) (C) The D value was determined by the first six points of the MSD-vs.-t curve from the start point, averaged for all locations of QDs covered by the trajectory during the 6-min period. (D and F) (Left) Diagrams illustrate the migratory behavior of the cell at two different times, and red dots depict QDs. (Right) The trajectories of the movement of the QDs on the l.p. (D, n = 75 QDs from 40 cells) and t.p. (F, n = 23 QDs from nine cells) of migrating cells during the observation. Red lines represent the average of all trajectories. (E and G) The distribution of QD movement in the l.p. (E) and t.p. (G) in 2-s (green), 12-s (blue), and 72-s (red) intervals. (H) Cumulative percentage for the distributions of D values found alongt he l.p. and t.p. of migrating cells. Data points below depict the mean D values (± SEM). No significant difference was found between the curves (P = 0.21, K-S test). (I) Mean value of the v values (± SEM) along the l.p. and t.p. of migrating cells. There was no significant difference (P > 0.42, t test). (J) Percentage of QDs showing drift movements in migrating cells in the forward (blue) and rearward (red) directions along the l.p. and t.p., respectively (P < 0.04, paired t test). The numbers associated with the bars represent the total number of QDs examined. *P < 0.05; ***P < 0.001. Error bars indicate SEM.

