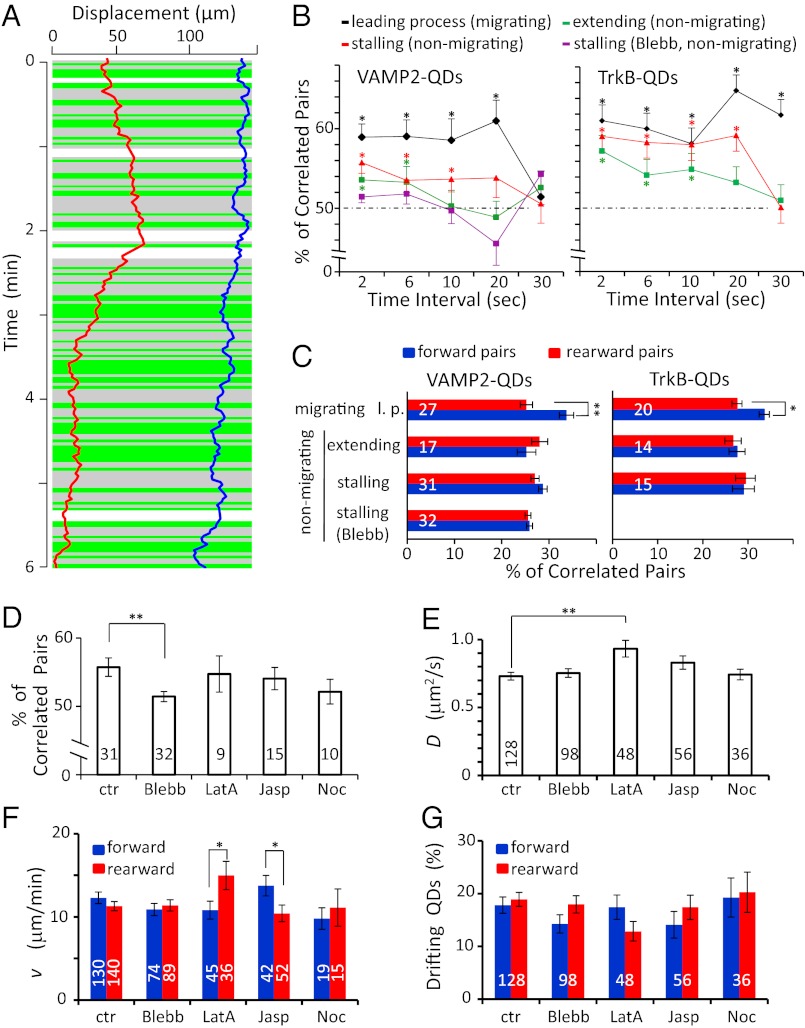
Fig. 6.
Correlation of the direction of surface movements between pairs of QDs. (A) An example of movement trajectories of 2 VAMP2-QDs during 6 min of observation, with correlation analysis of movement direction for successive 2-s time intervals along the l.p. of a migrating granule cell. Green and gray backgrounds indicate segments showing movements in the same and opposite directions, respectively. The white background marks a period when one or both QDs were not visible. (B) Percentage of VAMP2- and TrkB-QDs pairs showing drift in the same direction when the analysis was done at 2-, 6-, 10-, 20-, and 30-s intervals. The percentages for 2-s and 6-s intervals were found to exhibit significant bias toward correlated movements in the l.p. of migrating cells and in the extending or stalling process of nonmigrating cells (P < 0.05, binomial test). For each cell, we obtained an average percentage of QD pairs showing correlated direction of movement over 6–10 min observation, for all possible pairs of QDs on the same cell. Note that 50% represents correlation by chance, i.e., no correlated drift movement, and that the bias found in the stalling process of nonmigrating cells was abolished by the treatment with blebbistatin (Blebb). (C) The percentage of QD pairs analyzed at 2-s intervals showing correlated movement in the forward and rearward directions, respectively. The remaining percentage comprises pairs showing movements in opposite directions. The percentage of pairs showing forward-correlated movements was significantly higher than the percentage of pairs with rearward-correlated movements in the l.p. of migrating cells (P < 0.02, paired t test) but not in the nonmigrating cells. Numbers associated with the bars represent the total number of cells examined for correlated drift movements. (D) Average percentage of VAMP2-QD pairs showing correlated direction of movement in the stalling processes of nonmigrating neurons in the control condition and after treatment with 50 μM blebbistatin (Blebb, n = 32, P = 0.008, t test, relative to controls), 2 μM latrunculin A (LatA, n = 9), 2 μM jasplakinolide (Jasp, n = 15), and 16 μM nocodazole (Noc, n = 10). (E) Average D value for VAMP2-QDs in stalling processes of nonmigrating neurons in the control condition and after the drug treatments. (LatA, P = 0.004, t test, relative to controls). (F and G) The mean speed of drift movements and the percentage of QDs with drift in the forward (blue) and rearward (red) directions on stalling processes of nonmigrating cells in the control condition and after the drug treatment. The differences in mean v between the forward and rearward directions in panel F were significant after latrunculin A and jasplakinolide treatment (P = 0.05 and 0.04, respectively, t test). The numbers associated with the bars represent the total number of QDs examined. *P < 0.05; **P < 0.01. Error bars indicate SEM.

