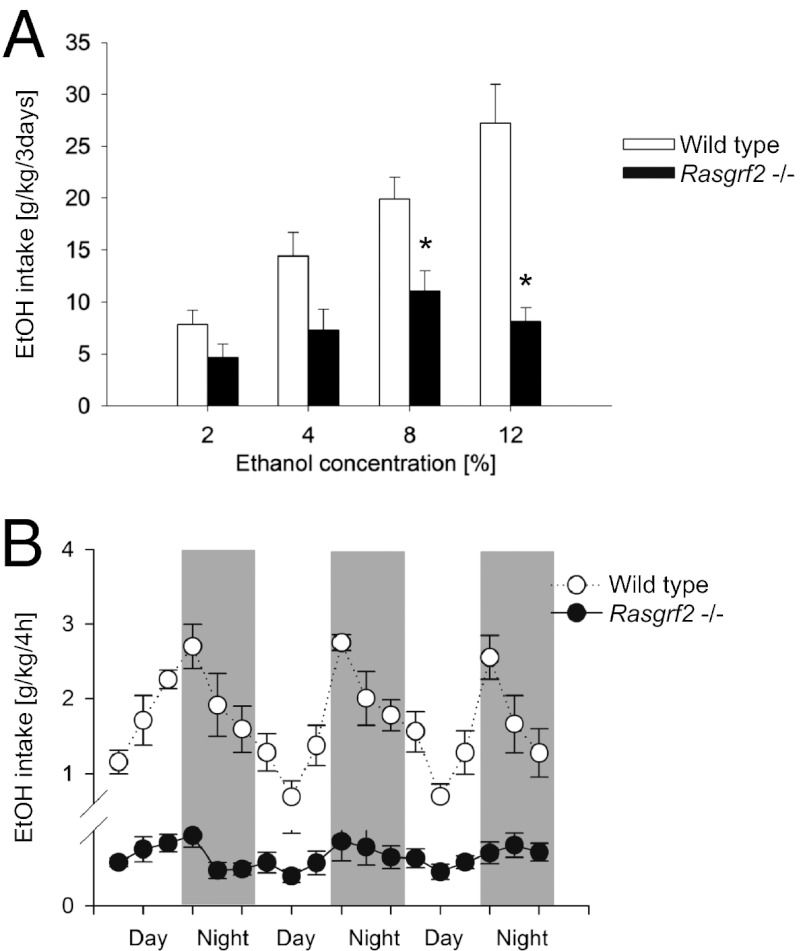
Fig. 1.
Ethanol intake is reduced in Rasgrf2−/− mice relative to WT controls. (A) Mean (+ SEM) intake of solutions containing increasing concentrations of ethanol in a two-bottle free choice test over a 3-d period (n = 12–13). A two-way ANOVA revealed a significant effect of genotype (F1,23 = 21.5; P < 0.0001) and ethanol concentration (F3,69 = 8.4; P < 0.001) as well as a significant genotype × concentration interaction effect (F3,69 = 8.4; P < 0.0001) on ethanol intake. (B) Mean (± SEM) drinking patterns of a 12% ethanol solution in the home cage over a 3-d period (n = 8–9). A two-way ANOVA revealed a significant genotype (F1,12 = 70.4; P < 0.00001), circadian (F17,204 = 9.3; P < 0.00001), and genotype × circadian (F17,204 = 8.1; P < 0.00001) effect. *P < 0.05.

