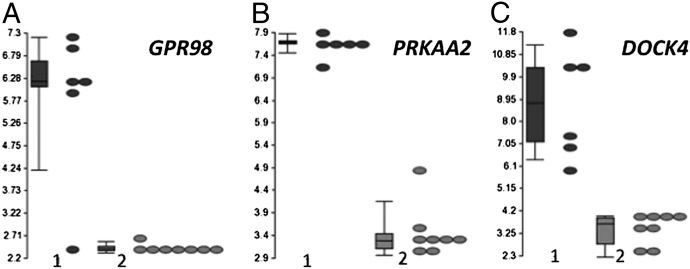
Fig. 4.
Differential GPR98, PRKAA2, and DOCK4 mRNA expression in CRC cell lines. (A–C) Box-and-whiskers plots of GPR98, PRKAA2, and DOCK4 mRNA expression in triple WT CRC cells that were resistant (group 1) or sensitive (group 2) to the effects of cetuximab. The y axis represents the mRNA level with the values plotted on a log2 scale. The bottom and top of the boxes represent the 25th and 75th percentiles, respectively; the whiskers represent the 10th to the 90th percentiles.

