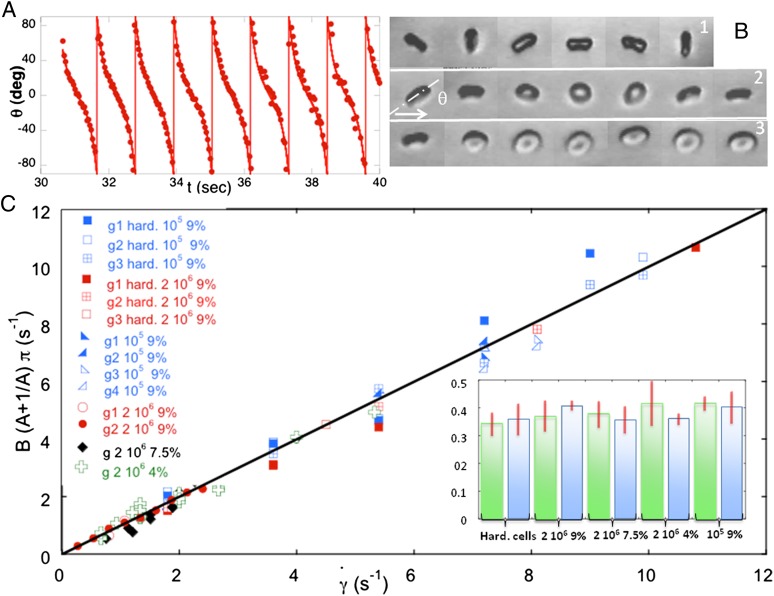
Fig. 3.
Flipping of RBCs observed in the shear plane (y-view). (A) Experimental time variation of the inclination angle θ ( = 9 s−1) and fit by the function
  (solid curve). (B) Variation of the orbit of one flipping RBC with increasing shear rate [dextran 2 106 g/mol, c = 9% (wt/wt)]. (B, 1)
  , time sequence of 10.6 s. (B, 2)
  , time sequence of 13.72 s. (B, 3)
  , time sequence of 3.84 s. (C) Variation of the product
  with the shear rate, where A and B are determined from the fit:
  . The variation is in agreement with Jeffery and KS laws (solid line: bisector). (C, Inset) Histogram of values of A obtained by the fits for RBCs in various conditions. Stiffened and normal cells in dextran 105 g/mol, c = 9% (wt/wt) (green)
  , (blue)
  . Cells in dextran 2 106 g/mol, c = 9% and 7.5%: (green)
  , (blue)
  .
.

