Fig. 4.
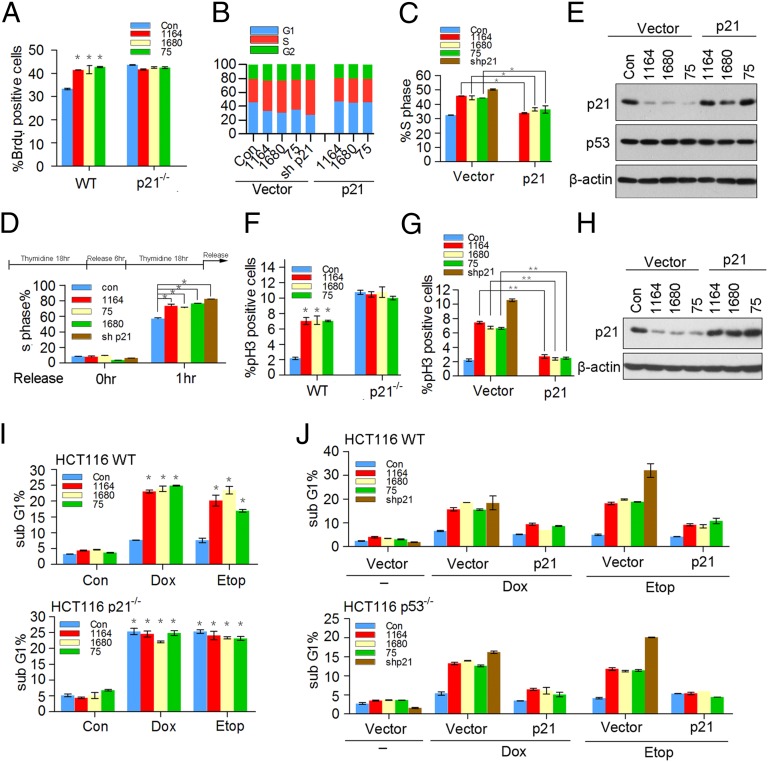
TRIM39 regulates the G1/S transition and DNA damage-induced G2 checkpoint in a p21-dependent manner. (A) HCT116 WT and HCT116 p21−/− cells infected with the indicated shRNAs were pulse labeled with BrdU for 30 min before harvesting and then analyzed by flow cytometry. Bar graph showing the percentages for S phase cells. The error bars represent the mean ± SD of three independent experiments. *P < 0.05. (B) HCT116 WT cells stably expressing vector or p21 were infected with the indicated lentiviral shRNAs for 72 h. Propidium iodide (PI)-stained cells were then subjected to flow cytometry analysis for their DNA content. The bar graph shows the percentages for G1, S, and G2/M cells. Results are one trial representative of three independent experiments. (C) S-phase percentage of cells in B is graphed. The error bars represent the mean ± SD of three independent experiments. *P < 0.05. (D) HCT116 WT cells stably expressing the indicated shRNAs were synchronized by a double thymidine block. The released cells were then harvested and analyzed by flow cytometry. The error bars represent the mean ± SD of three independent experiments. *P < 0.05. (E) Cell lysates in B were harvested and analyzed by Western blotting. (F) HCT116 WT and HCT116 p21−/− cells stably expressing the indicated shRNAs were pretreated with 0.2 μM doxorubicin for 2 h, followed by synchronization with nocodazole (100 ng/mL) for 16 h. The mitotic index was determined by mitotic marker pH3 staining. The error bars represent the mean ± SD of three independent experiments. *P < 0.05. (G) HCT116 p53−/− cells stably expressing vector or p21 were infected with the indicated lentiviral shRNAs for 72 h. Cells were then treated as described in F. The error bars represent the mean ± SD of three independent experiments. **P < 0.01. (H) Cell lysates in G were harvested and analyzed by Western blotting. (I) HCT116 WT cells (Upper) and HCT116 p21−/− cells (Lower) were infected with the indicated lentiviral shRNAs for 72 h. Cells were then treated with 0.2 μM doxorubicin (Dox) or 5 μM etoposide (Etop) for 24 h, followed by FACS analysis of the sub-G1 fraction. The error bars show the mean ± SD of three independent experiments. *P < 0.05. (J) HCT116 WT cells (Upper) and HCT116 p53−/− cells (Lower) stably expressing vector or p21 were infected with the indicated lentiviral shRNAs for 72 h. Cells were then treated as described in I. The error bars show the mean ± SD of three independent experiments.

