Fig. 2.
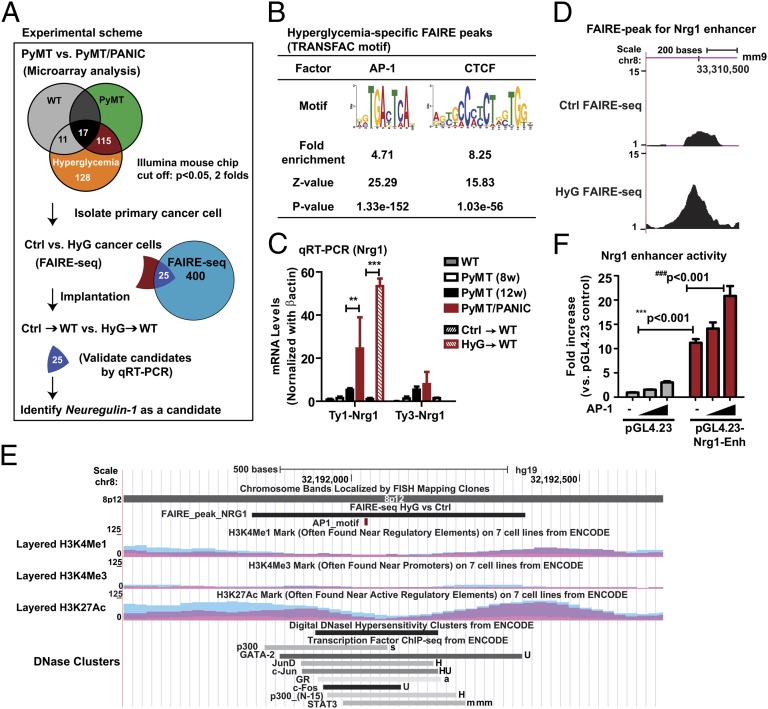
Identification of Nrg1 as a candidate gene engaged in the hyperglycemic memory effects in mammary cancer cells. (A) Integrated genomic approach that identified Nrg1. Microarray analysis was performed for RNA from tumors of PyMT/PANIC and PyMT mice as well as from mammary adipose tissues of PANIC-ATTAC and wild-type mice (Fig. S2). The subset of genes specifically modulated by hyperglycemia in tumors was retained for further analysis. Global analysis of open chromatin conformation was performed by FAIRE-seq with primary cancer cells isolated from tumor tissues of PyMT (Ctrl) and PyMT/PANIC (HyG). Twenty-five candidate genes were selected by cross-comparison of microarray data and FAIRE-seq data. qRT-PCR was used to validate the expression of candidate genes in tumors of PyMT/PANIC and PyMT and of HyG and Ctrl xenograft tumors (Fig. S3). (B) Enrichment analysis for AP-1 and CTCF motifs in hyperglycemia-specific FAIRE peaks. (C) qRT-PCR for Nrg1 mRNA levels. β-actin was used as a control. Data represent mean ± SEM **P < 0.01, ***P < 0.001 by two-way ANOVA. n = 6–8 per group. (D) The FAIRE peak in the HyG chromatin indicates a hyperglycemia-specific open chromatin region that may represent an active enhancer for Nrg1. The position of the FAIRE peak in the mouse genome (assembly mm9) in the University of California Santa Cruz (UCSC) Genome Browser is indicated. The y axis represents the number of the normalized FAIRE read frequencies. (E) The homologous region of the putative Nrg1 enhancer in the human genome. The position of the region in the human genome (assembly Hg19) in the UCSC Genome Browser is indicated. The conserved putative AP-1 motif is highlighted in red. Binding regions for multiple transcription factors, the levels of histone modifications and DNaseI hypersensitivity as obtained from ENCODE are shown. (F) Luciferase reporter assay in CHO cells. Enhancer element was inserted in the reporter vector containing a minimal promoter (pGL4.23), and assay was determined at 2 d after transfection in the presence or absence of the AP-1 transcription factor. Data represent mean ± SEM three independent experiments were performed. ***P < 0.001 and ###P < 0.001 by two-way ANOVA.

