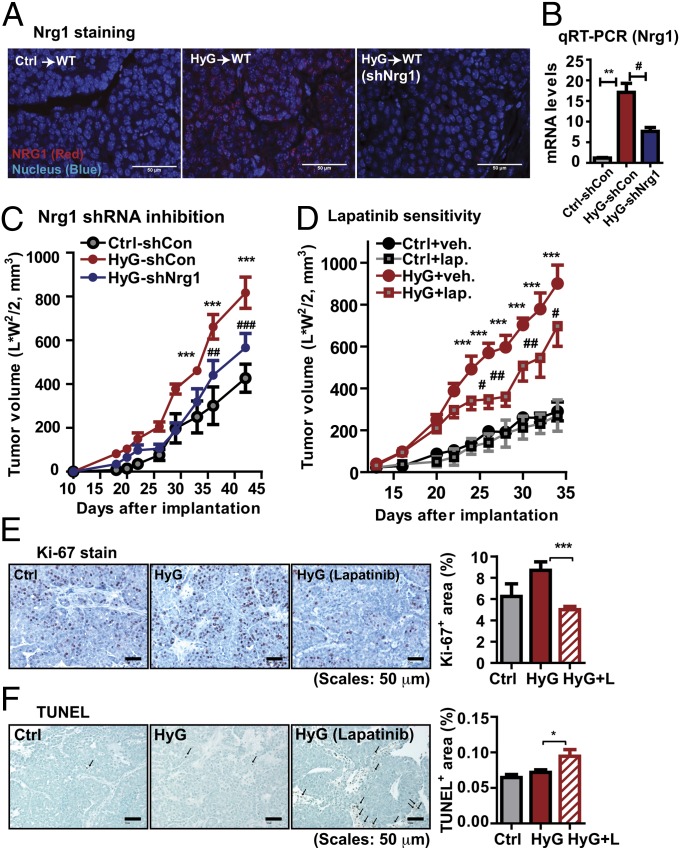
Fig. 3.
Nrg1 acquisition in HyG-tumors enhances tumor malignancy. (A) Nrg1 immunostaining, showing a strong Nrg1 signal in HyG-tumors, but not in Ctrl-tumors. shRNA-mediated Nrg1 knock down in HyG tumors decreases Nrg1 levels. (Scale bars: 50 μm.) (B) Total RNA was prepared from the tumor tissues of scrambled shRNA-infected Ctrl cells (Ctrl-shCon), scrambled shRNA-infected HyG cells (HyG-shCon), and Nrg1 shRNA-infected HyG cells (HyG-shNrg1) bearing mice. mRNA levels for Nrg1 were determined by qRT-PCR. mRNA levels were normalized with β-actin and represented as mean ± SEM (n = 8 per group). **P < 0.01 Ctrl-shCon vs. HyG-shCon; #P < 0.05 vs. HyG-shCon vs. HyG-shNrg1 by unpaired Student’s t test. (C) Tumor growth for the Nrg1 knock downed HyG-tumors, showing a reduced growth rate compared with HyG-tumors. ***P < 0.001 vs. Ctrl-shCon; ##P < 0.01, ###P < 0.001 vs. HyG-shCon by two-way ANOVA. n = 8 per group. (D) Lapatinib treatment (100 mg/kg per day by oral gavage) of HyG-tumor bearing mice, showing that a RTK inhibitor attenuated growth of HyG tumor (n = 10), but less affected of Ctrl tumors (n = 8). ***P < 0.001 vs. Ctrl; #P < 0.05 and ##P < 0.01 vs. HyG by two-way ANOVA. (E) Proliferation indices were determined by Ki-67 staining. Quantified results represent mean ± SEM (n = 5 per group). Three different fields per sample were analyzed. ***P < 0.01 vs. HyG by unpaired Student’s t test. (F) Apoptosis was determined by TUNEL assays. Quantified results represent mean ± SEM (n = 3 per group). Three different fields per sample were analyzed. *P < 0.05 vs. HyG by unpaired Student’s t test.

