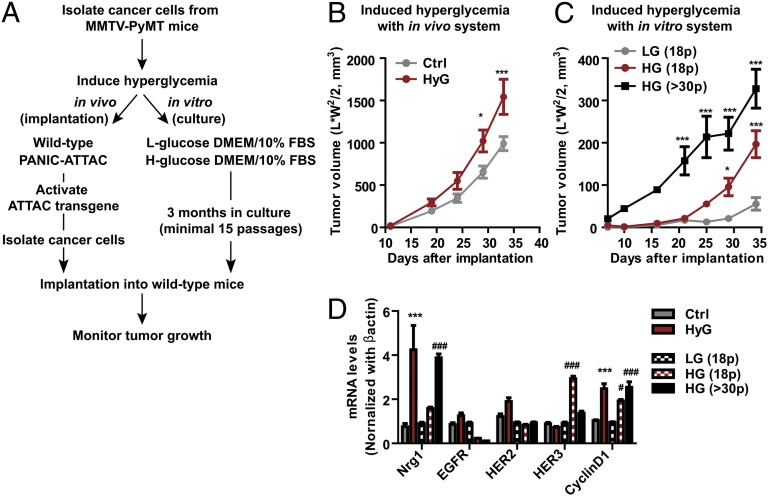
Fig. 4.
High levels of glucose confer malignancy to cancer cells. (A) Schematic diagram of hyperglycemic challenges to primary cancer cells in vivo and in vitro. (B) Upon secondary implantation into euglycemic hosts, tumor growth for hyperglycemia-exposed primary cancer cells originally grown in PANIC-ATTAC mice was faster in comparison with those isolated from wild-type mice. Cancer cells were exposed to hyperglycemia for 1 mo in vivo. Tumor volume represents mean ± SEM (n = 8 per group). *P < 0.05, ***P < 0.001 vs. Ctrl by two-way ANOVA. (C) Primary cancer cells isolated from PyMT mice were cultured with different glucose concentrations [low (LG, 1 g/L) vs. high glucose (HG, 4.5 g/L)] supplemented with 10% FBS for 3 mo (over 15 passages). These cells were then implanted into wild-type mice and tumor growth was monitored. Tumor volume represents mean ± SEM (n = 8–9 per group). *P < 0.05, ***P < 0.001 vs. LG (18 passages) by two-way ANOVA. (D) Total RNA was isolated from cancer cells from tumors grown in PANIC-ATTAC mice (HyG) or wild-type mice (Ctrl) as well as those cultured with either low glucose (18 passages) or high glucose (18 and more than 30 passages) media. mRNA levels for Nrg1, EGFR, HER2, HER3, and cyclinD1 were determined by qRT-PCR. Results represent mean ± SEM (n = 5 per group). ***P < 0.001 vs. Ctrl; #P < 0.05, ###P < 0.001 vs. LG (18p) by two-way ANOVA.

