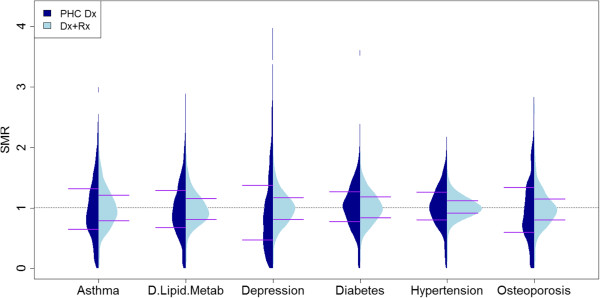
Figure 1.
Comparison of the distribution of the Standardized Morbidity Ratio by doctor’s lists in the medical conditions under study, by data source: primary health care diagnoses (PCH Dx) and the combination of primary care and hospital diagnoses and primary care prescriptions (Dx + Rx). Horizontal lines correspond to values of percentiles 25 and 75.

