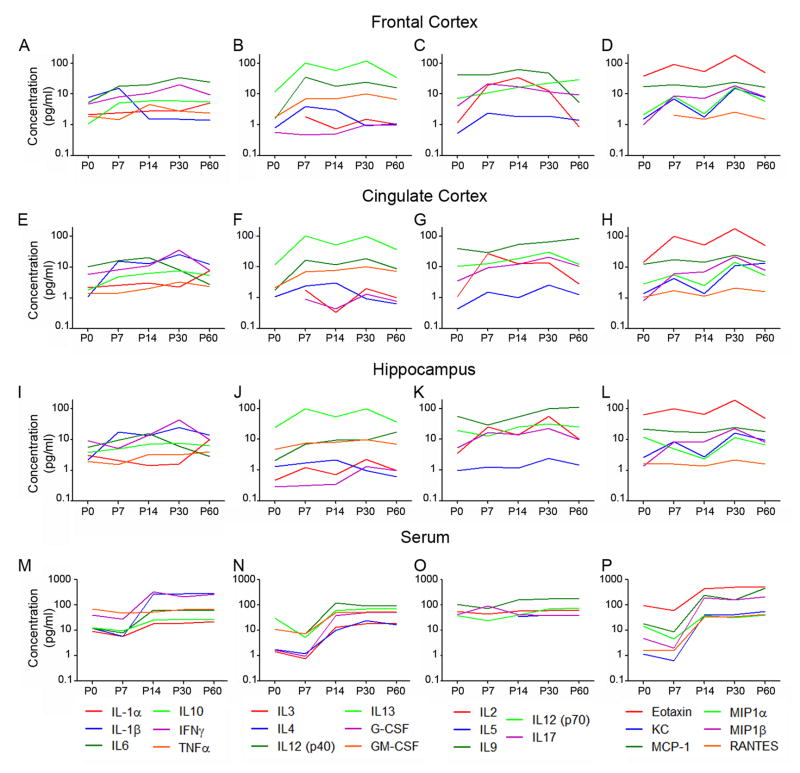
Figure 1. Many cytokines are expressed in serum and brain throughout normal development.
Cytokine concentrations in the typically-developing brain change with age and some are region-specific. To illustrate changes in cytokine concentrations with age, the average values for each cytokine concentration are plotted at the five ages examined. Cytokine concentrations are plotted in pg/mg brain tissue (A–L) and pg/ml serum (M–P) for FC (A–D), CC (E–H), HC (I–L), and serum (M–P). The 23 cytokines are separated into 4 groups: (1) commonly-studied brain cytokines (A,E,I,M) including IL-1α, IL-1β, IL-6, IL-10, IFNγ, and TNFα, (2) a first set of additional cytokines with similar step-like changes in serum concentration with age (B,F,J,N) including IL-3, IL-4, IL-12(p40), IL-13, G-CSF, and GM-CSF, (3) a second set of additional cytokines with stable levels in serum (C,G,K,O) including IL-2, IL-5, IL-9, IL-12(p70), and IL-17, and (4) chemokines (D,H,L,P) including Eotaxin, KC, MCP-1, MIP1α, MIP1β, and RANTES. Error bars are not included in these graphs to enhance visibility of the trends in expression, however all values of mean ± SEM concentration are included in Suppl. Tables 1 and 2.

