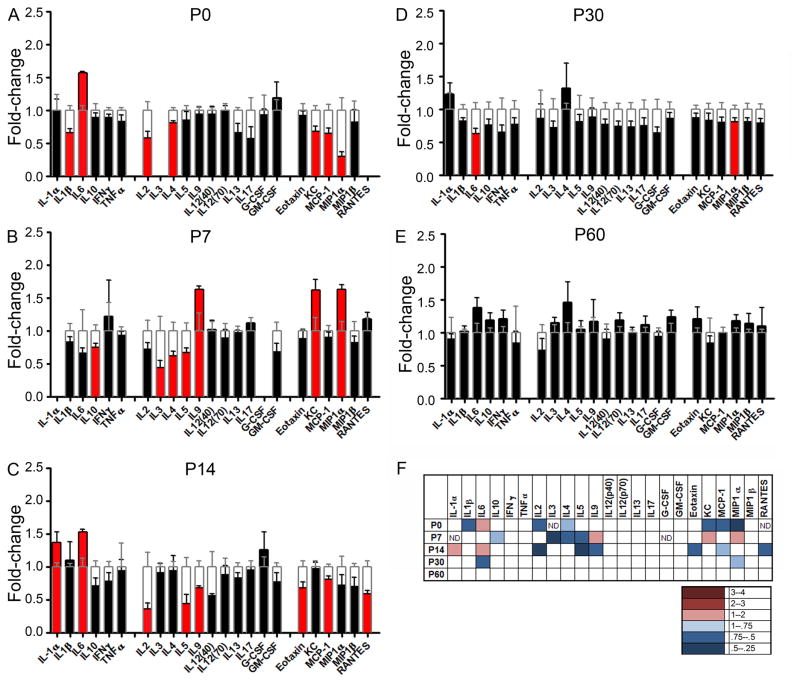
Figure 4. MIA induces long-lasting changes in cytokines in hippocampus throughout development.
Data is plotted as in Fig. 2. (A) At P0, MIA induces higher levels of IL-6 and lower levels of six other cytokines, while MIP1α, IL-3, and RANTES are below the level of detection. (B) At P7, three cytokines are elevated, while four are lower than controls. IL-1α and G-CSF are below the level of detection. (C) At P14, IL-1α and IL-6 are higher and six other cytokines are lower than controls. (D) At P30, IL-6 and MIP1α are lower than controls. (E) At P60, no cytokines levels are changed relative to controls. (F) A heat map summarizes the results for MIA-induced changes in cytokines at all ages examined. Statistically significant changes are indicated in color: red indicates increases and blue, decreases in cytokine levels compared to controls. The degree of change is indicated by the depth of color as indicated in the lower panel. ND = below the level of detection. n = 5–6 brains per treatment group (pooled from at least two independent litters).

