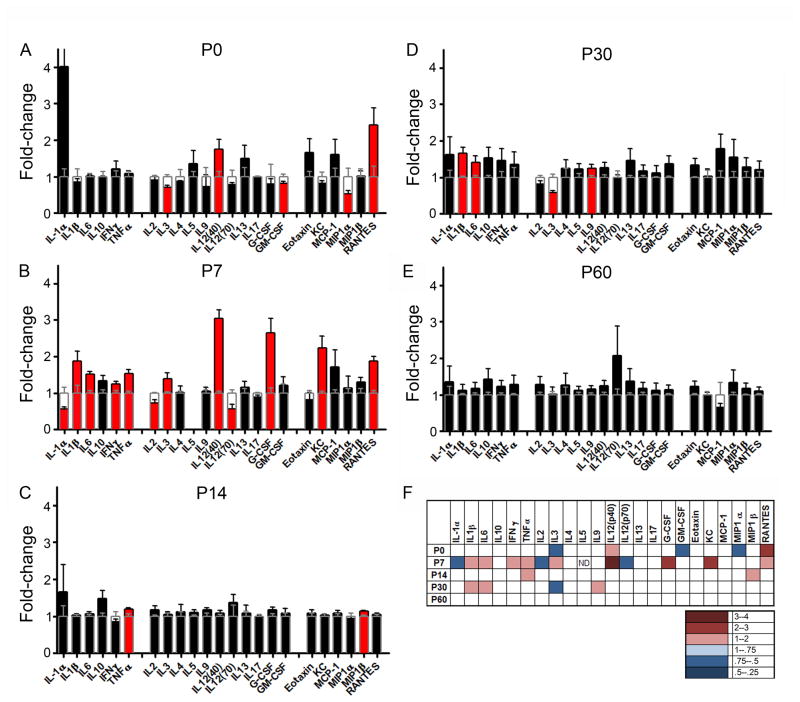
Figure 5. MIA induces long-lasting changes in cytokines in serum throughout development.
Data is plotted as in Fig. 2. (A) At P0, MIA increases two cytokines and decreases three. (B) At P7, MIA increases levels of nine cytokines and decreases three. IL-5 is below the level of detection at this age. (C) At P14, two cytokines are higher than controls. (D) At P30, three cytokines are increased and one is decreased. (E) At P60, no cytokines levels are changed relative to controls. (F) A heat map to summarize the results for MIA-induced changes in cytokines at all ages examined. Statistically significant changes are indicated in color: red indicates increases, and blue decreases, in cytokine levels compared to controls. The degree of change is indicated by the depth of color as indicated in the lower panel. ND = below the level of detection. n = 5–6 brains per treatment group (pooled from at least two independent litters).

