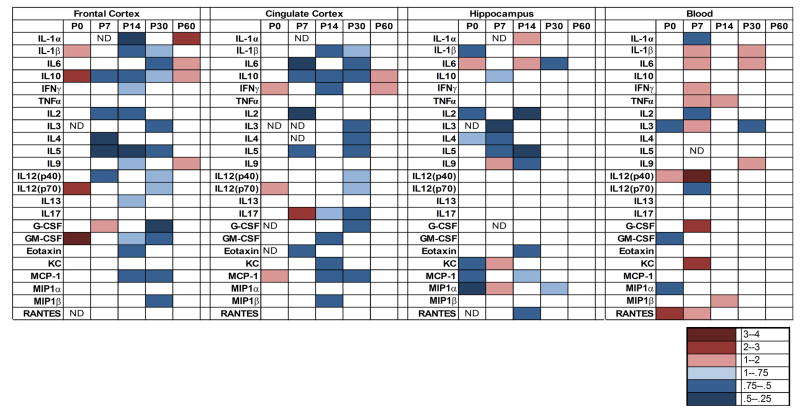
Figure 6. Summary of cytokine changes in brain and serum across development.
A heat map is used to summarize the results for MIA-induced changes in cytokines at all ages examined. Statistically significant changes are indicated in color: red indicates increases and blue indicates decreases in cytokine levels compared to controls. The degree of change is indicated by the depth of color as indicated in the lower panel. This figure clearly shows the similar overall pattern in MIA-induced cytokine changes in FC and CC during development, characterized by increases in cytokines at birth (P0) and in the adult (P60), and dramatic decreases in many cytokines during periods of synaptogenesis and activity-dependent plasticity (P7–P30). This pattern is distinct from that in HC, where there are both increases and decreases in cytokine in MIA offspring at all ages examined. Finally, MIA-induced changes in serum cytokines do not correlate with changes in brain cytokines. ND = below the level of detection.

