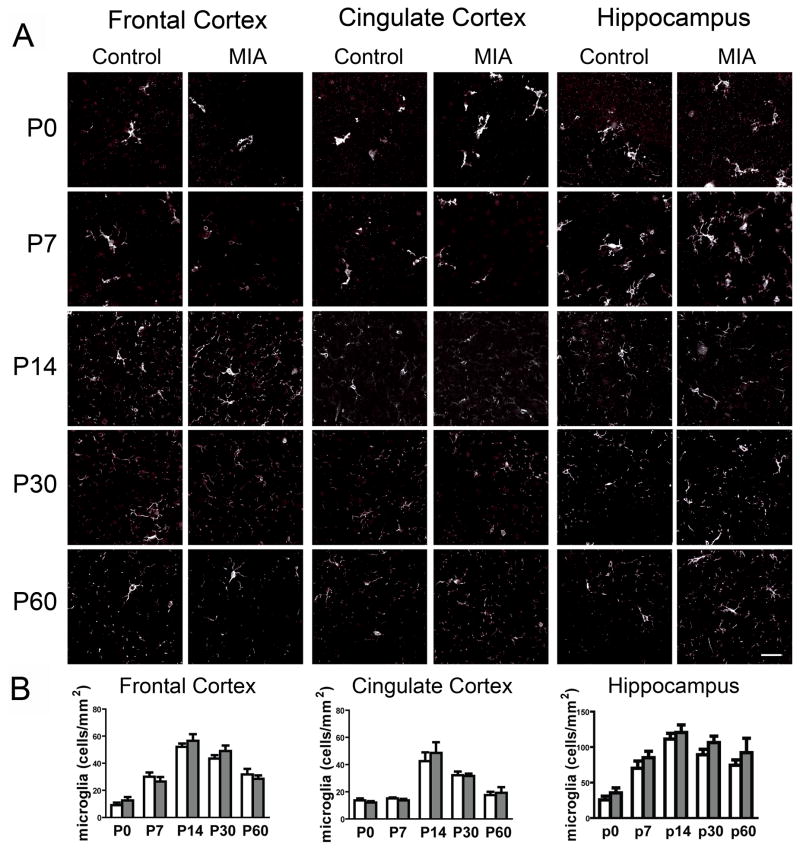
Figure 7. MIA does not alter microglial number or morphology.
The density of Iba1 + microglia (white) was quantified using Stereologer in each brain region at each age examined. (A) Representative images of coronal sections taken at 40X through FC, CC, and HC at five ages during postnatal development. (B) Quantification of the density of Iba1+ microglia for each brain region over age. The density generally increases from birth to P14 and then decreases to intermediate levels in the adult. There is no difference in microglial density between MIA and control brains. Open bars indicate control values and gray bars, MIA values.

