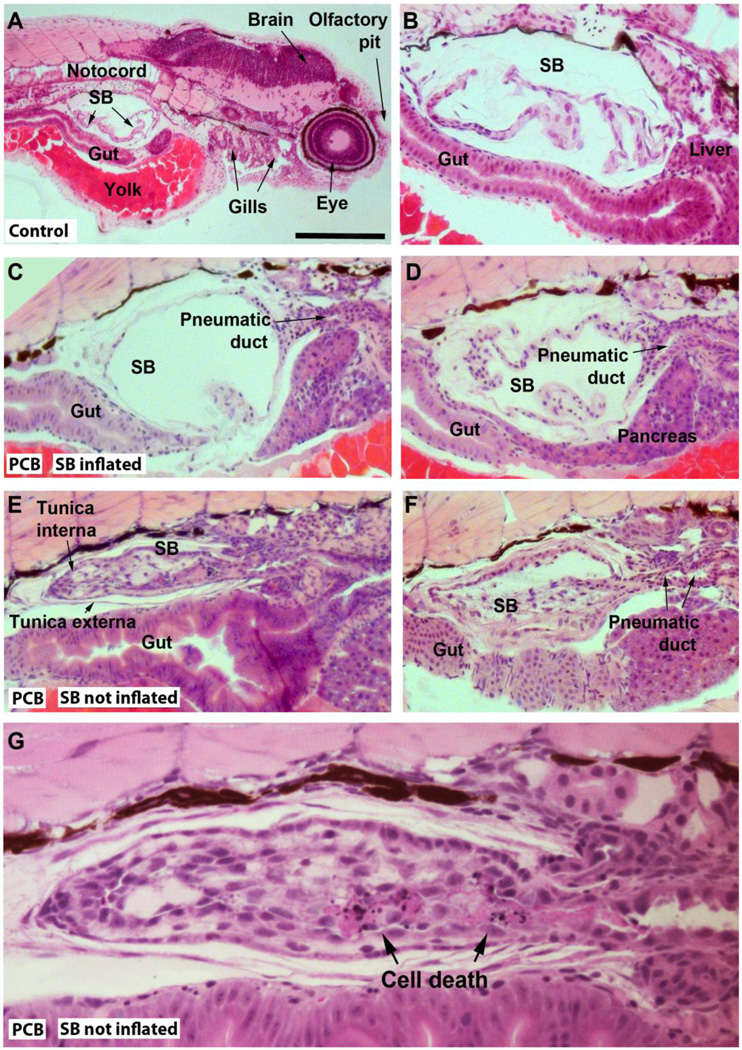
Figure 2.
Representations of histological sections of 4-day-old zebrafish embryos exposed to the carrier (0.01 % DMSO; A–B), or to 2 nM PCB126 (C–G). Exposure conditions are described in “Histology” in Materials and methods. Slides A–D show sections of embryos with a normal swimbladder phenotype (A–B: controls; C–D: PCB126-exposed) and E–F show swimbladders of embryos that failed to inflate their swimbladders (PCB126-exposed). SB=swimbladder. In G an area with cell death in the swimbladder tissue is indicated (another section from the fish represented in E). The scale bar shown in A represents approximately 400 µm (A), 100 µm (B–F), and 40 µm (G).

