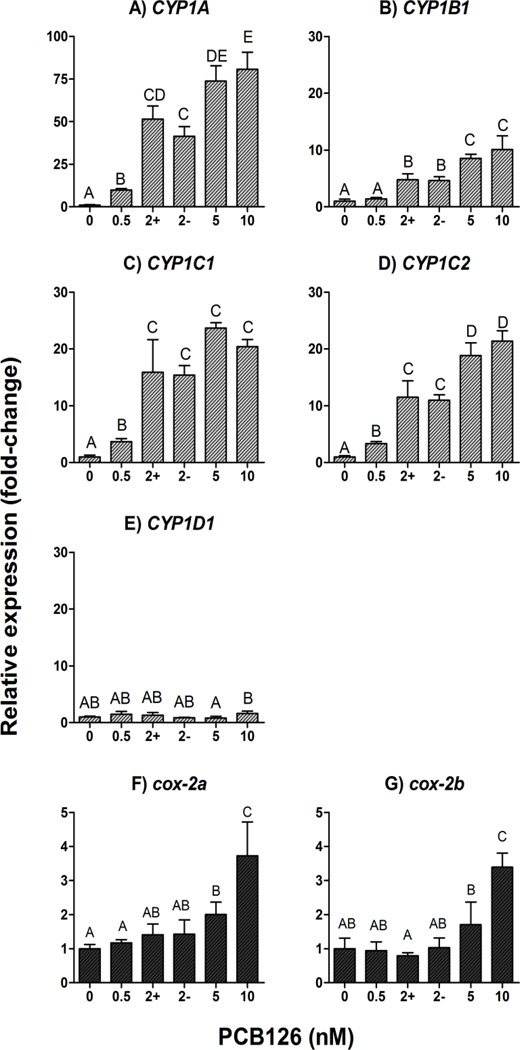
Figure 3.
Concentration-response relationship for PCB126 induced mRNA expression of CYP1 (A–D) and cox-2 (E–F) in developing zebrafish (determined at 4 dpf). Detailed exposure regimen is given in Figure 1A. Embryos were exposed to carrier (0.02% DMSO) or various concentrations of PCB126 (0.5, 2, 5, or 10 nM) for 24 hours starting at 1 dpf. At 4 dpf, embryos were sorted based on whether they exhibited inflated swimbladder or not, and sampled for quantitative real time PCR analysis. In the figures, “+” and “−“ in horizontal axis represent the groups of embryos that exhibited inflated and uninflated swimbladder, respectively. Relative expression (fold-control) was calculated by E−ΔΔCt (Livak and Schmittgen, 2001), using ef1a as a reference gene. Statistical differences among groups were determined by one-way ANOVA followed by Tukey’s multiple comparisons test and are shown by different letters (p<0.05, n=4).

