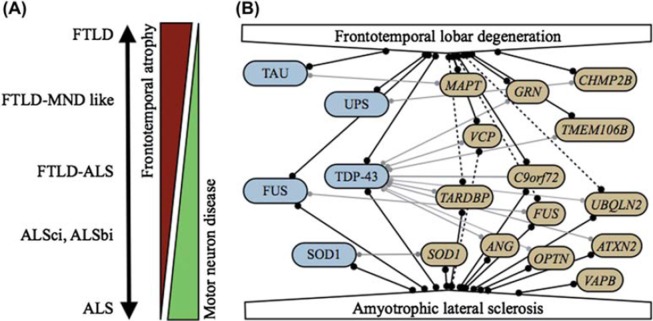
Figure 1.
A: FTLD and ALS form a clinical disease continuum. B: Molecular relationships between FTLD and ALS. Pathological proteins are indicated in blue, causal genes in yellow. Full lines indicate strong correlations; dotted lines represent putative correlations. Correlations between genes and pathological proteins are indicated by light gray lines.

