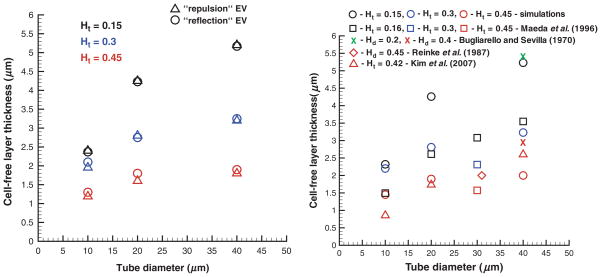
Figure 10.
CFLs obtained in blood flow simulations employing the “repulsion” and “reflection” EV interactions (left) and the “wall force” setup in comparison with experimental data [20,22,30] (right) for various Ht values and tube diameters. Ht is the tube hematocrit and Hd is the discharge hematocrit.

