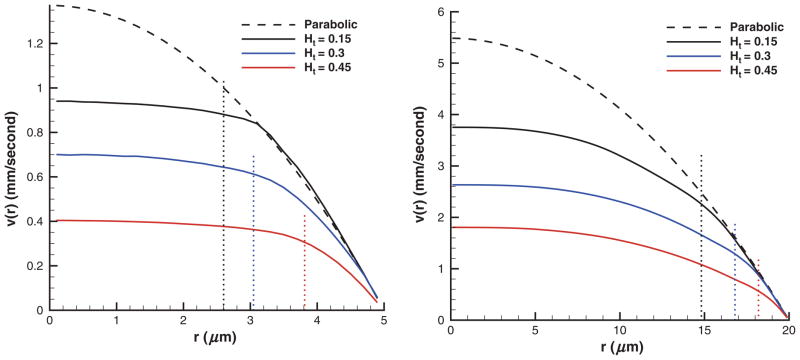
Figure 2.
Typical velocity profiles of blood flow in tubes of diameters D = 10 μm (left) and D = 40 μm (right) for different Ht values employing “repulsion” EV interactions. Dashed lines show the corresponding parabolic profiles of the Newtonian plasma with no cells present for the same pressure gradients. Dotted lines indicate the corresponding CFL thicknesses. Ht is the tube hematocrit, r is the radial axis, and v(r) is the axial flow velocity.

