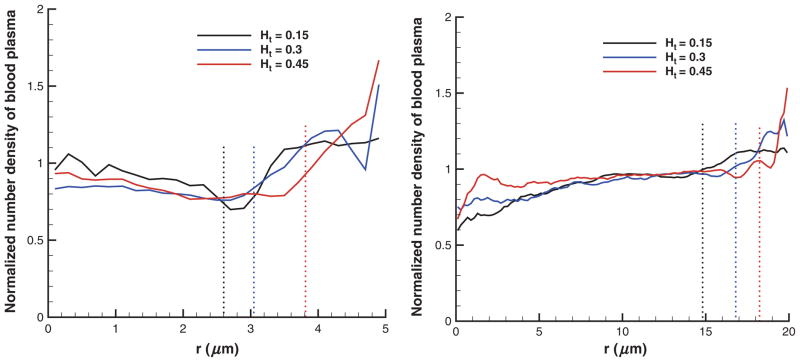
Figure 4.
Number density profiles of the suspending solvent normalized by their average in tubes of diameters 10 μm (left) and 40 μm (right) for different RBC volume fractions using “repulsion” EV interactions. Dotted lines denote the corresponding CFL thicknesses. Ht is the tube hematocrit and r is the radial axis.

