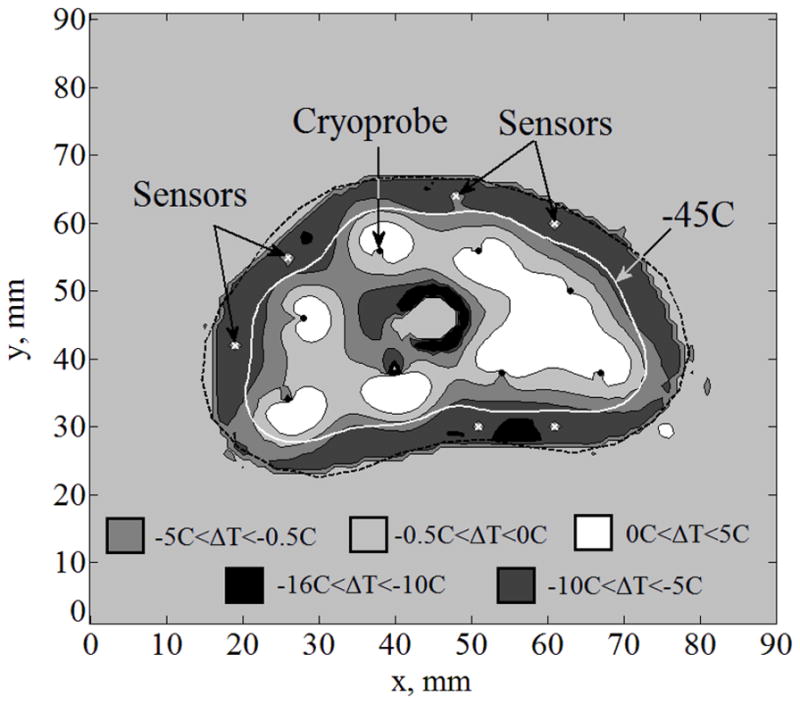
Figure 4.

Temperature fields difference, ΔT, between the benchmark solution and the solution for Case II: complete freezing front information (Case B) with six sensors implanted along the −22°C isotherm at the locations of maximum temperature difference in Fig. 3; cryoprobes are illustrated with black dots and sensors with white “×”.
