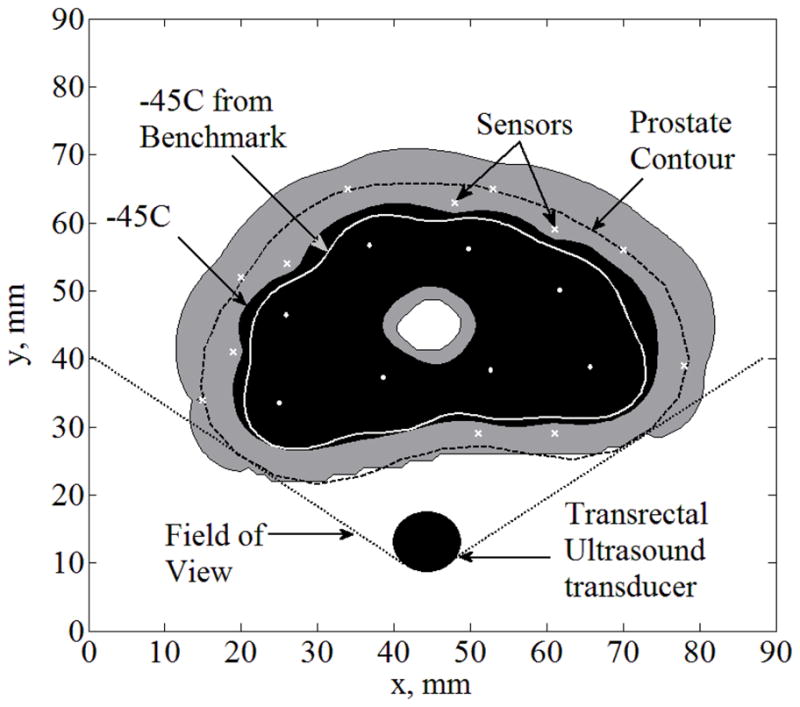
Figure 5.

Temperature field regions for Case III: partial freezing front information obtained from a transrectal ultrasound transducer (Case C), combined with six sensors implanted along the −22°C isotherm, and six additional sensors equally distributed along the unobservable portion of the prostate contour (upper portion of the figure); α is the field of view of the trans-rectal ultrasound transducer; cryoprobes are illustrated with white dots and sensors with white “×”.
