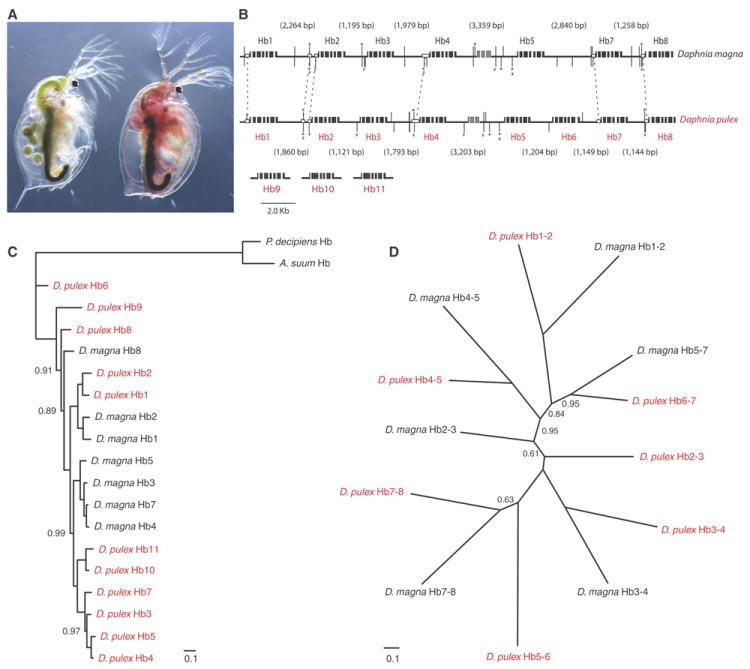
Figure 2.

Evolution of Daphnia di-domain hemoglobin (Hb) genes. A. When deprived of oxygen, many species (here D. magna) increase hemoglobin concentration in the hemolymph by 15-20 fold within a single molting, coloring the body red. B. Organization of the Hb gene cluster in the D. magna and the D. pulex genomes. Black boxes are exons. Gray boxes are exons of an RNA gene. Vertical bars are Hypoxia Response Elements (HRE) and asterisks show ancillary elements. Conserved HREs are linked by hatches. Open boxes represent highly similar sequences. The lengths of intergenic regions are shown in parentheses. Daphnia pulex genes Hb9-11 are located on separate sequence scaffolds. C. Phylogenetic tree (SOM V.2) from nucleotide sequences of Hb genes in D. pulex (red) and in D. magna (black). Outgroup Hb cDNA sequences are from Ascaris suum and Pseudoterranova decipiens. Scale bar shows mean number of differences (0.1) per nucleotide along each branch. Posterior probability node support <100% are shown. D. Phylogenetic tree based on nucleotide sequences of intergenic regions between the stop codons and the downstream TATA of the neighboring gene. Posterior probabilities <100% are shown.
