
Figure 3.
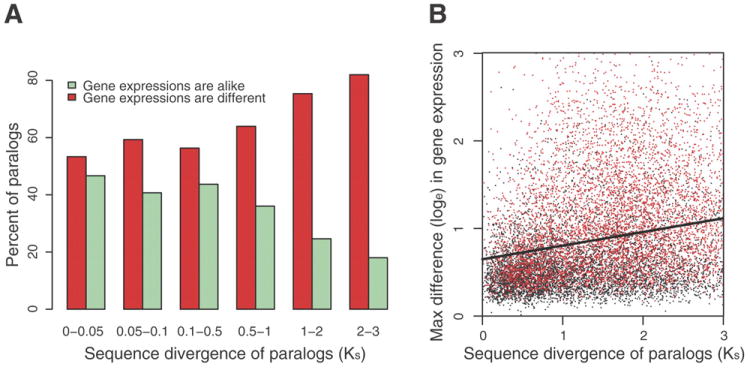
Functional diversification of duplicated genes, from 12 microarray experiments. A. The fraction of duplicated genes with similar versus divergent DE patterns as a function of their pair-wise divergence at silent sites (Ks). B. Regression (r = 0.29) of the maximum observed difference (treatment versus control) between duplicated genes among the 12 conditions as a function of the age of duplicated genes inferred from Ks. Red points are significant values (p < 0.05, ANOVA). The regression line Y-axis intercept (ln 0.642 ± 0.009) suggests that, on average, newly duplicated genes may differ in expression by as much as 1.9 fold at particular conditions, which is significantly different from zero (t = 68.7, p < 2 × e-16) and validated by tiling microarray data (r = 0.16; t = 75.3, p < 2 × e-16).