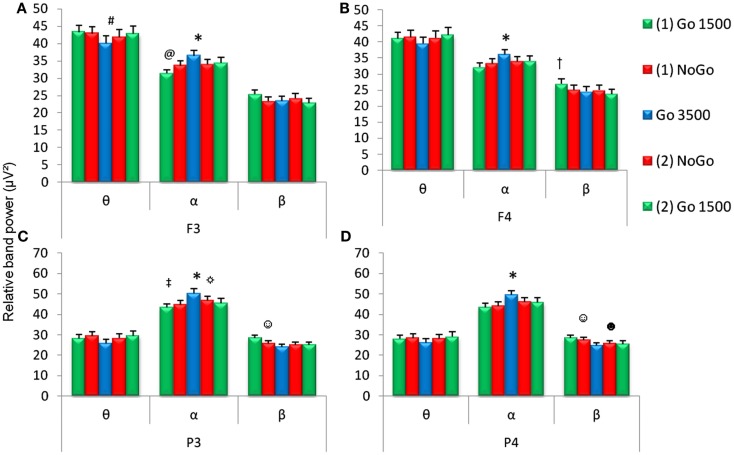
Figure 3.
Relative EEG band power during the five conditions of the GNG task (first go condition, first no-go, go 3500 condition, second go condition, and second no-go conditions). Relative frequencies reported include theta (θ, 4–7 Hz), alpha (α, 7–14 Hz), and beta (β, 15–30 Hz) for frontal (F3 and F4) and parietal (P3 and P4) electrodes. *For all (A–D) α band power was higher during the go 3500 condition compared to first go condition, first no-go, and second no-go condition. (A) #F3 θ band power was lower during the go 3500 condition compared to the first go condition and first no-go condition and @F3 α band power was lower during the first go 1500 condition compared to the second no-go and second go condition. (B) †F4 β band power was higher during the first go condition compared to the second no-go and second go condition). ‡P3 α band power was lower during the first go condition compared to the second no-go condition. ☼P3 α band power was lower during the second go condition compared to the go 3500 condition. ☺Parietal (C,D) β band power was higher during the first no-go condition compared to the go 3500 condition. (D) ☻P4 β band power was lower during the second go condition compared to the first no-go condition (p < 0.0071, n = 53, mean ± SEM).

