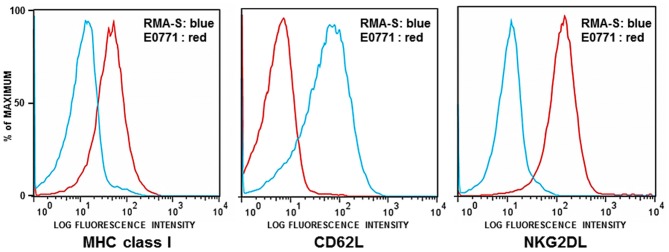
Figure 1.
Flow cytometric analysis of RMA-S and E0771 tumor cells. RMA-S and E0771 cells were immunostained for cell surface expression of MHC class I, NKG2D ligands (NKG2DL), and L-selectin (CD62L). Histograms depict RMA-S in blue and E0771 in red. The X axes indicate the fluorescence intensity of staining for MHC class I, NKG2DL, and CD62L. The Y axes represent the number of cells analyzed, normalized to the percentage of maximum events.

