Figure 3.

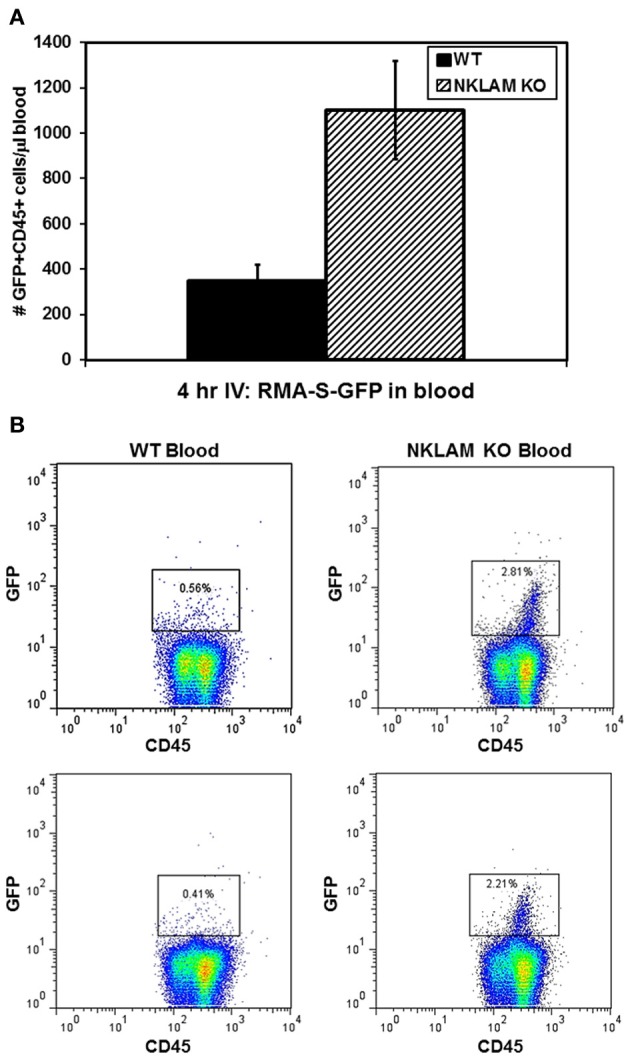
Higher levels of circulating RMA-S-GFP cells in the blood of NKLAM KO than WT mice. Four hours after intravenous injection of RMA-S-GFP cells, blood from NKLAM KO (n = 5) and WT mice (n = 5) were analyzed for GFP expression by flow cytometry. (A) Results are expressed as the number of GFP+ CD45+ cells per μL of blood. (p < 0.02). (B) Representative histogram plots of blood from NKLAM KO and WT blood are shown. Tumor cells (GFP+ CD45+) are within the box. The percentage of GFP+ RMA-S cells within the CD45+ population in each sample is shown.
