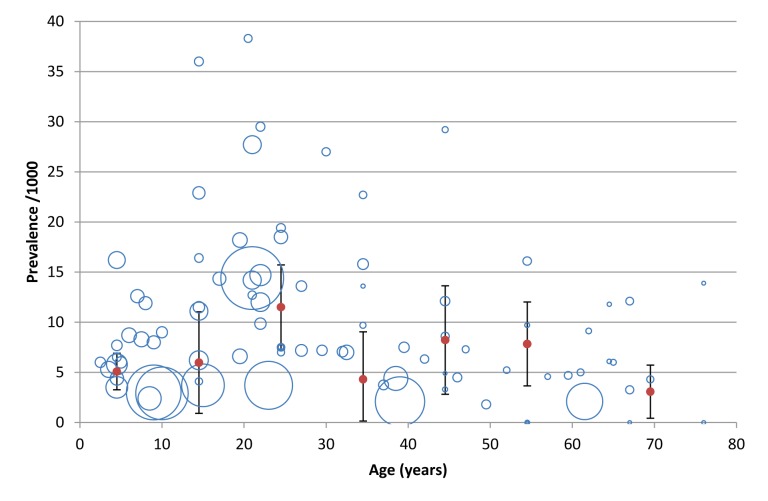
Figure 4.
Prevalence of active epilepsy by age: the size of the bubble is determined by the size of the sample for which the prevalence was calculated in original data, while the solid red data points represent the weighted mean of the prevalence for each 10–year age group, along with the error bars representing the 95% confidence intervals.

