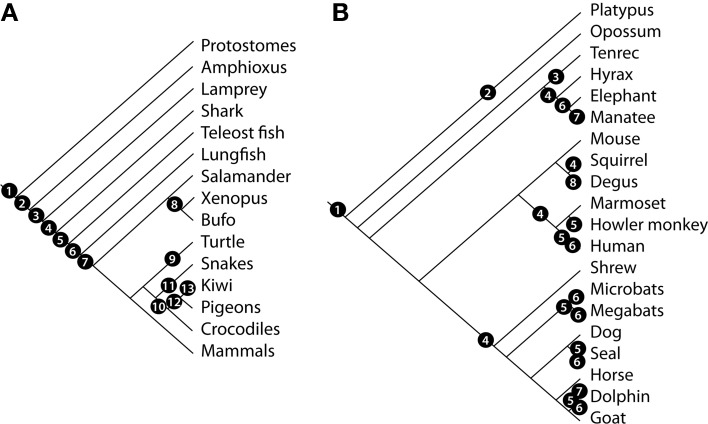
Figure 6.
Evolution of the vertebrate MOS and VNS. Cladogram showing the phylogenetic relationships of vertebrate species and relevant events related to the evolution of the MOS and VNS (A) according to the following numbers: 1, presence of a primitive olfactory system; 2, evolution of the classical vertebrate olfactory receptor (OR) genes; 3, evolution of the olfactory projections and origin of V1R and TRPC2 genes; 4, origin of V2R genes; 5, expression of ORs, V2R, and V1R in the OE; 6, origin of a distinctive VNS (VNO-AOB-MeA projection); 7, segregation of vomeronasal pathways; shift in receptor ratios associated to land colonization; 8, differential expression of G-proteins in aquatic vs. terrestrial species; 9, reduction of OR gene repertoire in aquatic species; 10, loss of the VNS in Archosauria; 11, expansion of vomeronasal structures in lepidosaurs; 12, evolution of bird-specific OR genes; 13, expansion of OR gene repertoire in terrestrial/nocturnal birds. (B) Evolution of the mammalian MOS and VNS. Cladogram showing the phylogenetic relationships of mammalian species and relevant events related to the evolution of the MOS and VNS. 1, Two-pathway segregated VNS, AOB dorsal to the OB; 2, amplification of V1R genes; 3, non-exclusive segregation of AOB glomeruli expressing Gαi2 and Gαo proteins; 4, loss of the V2R—Gαo pathway; 5, pseudogenization of OR genes; 6, loss of the vomeronasal system; 7, loss of the OBs; 8, lateral AOB innervation and cell indentation between AOB subdomains.

