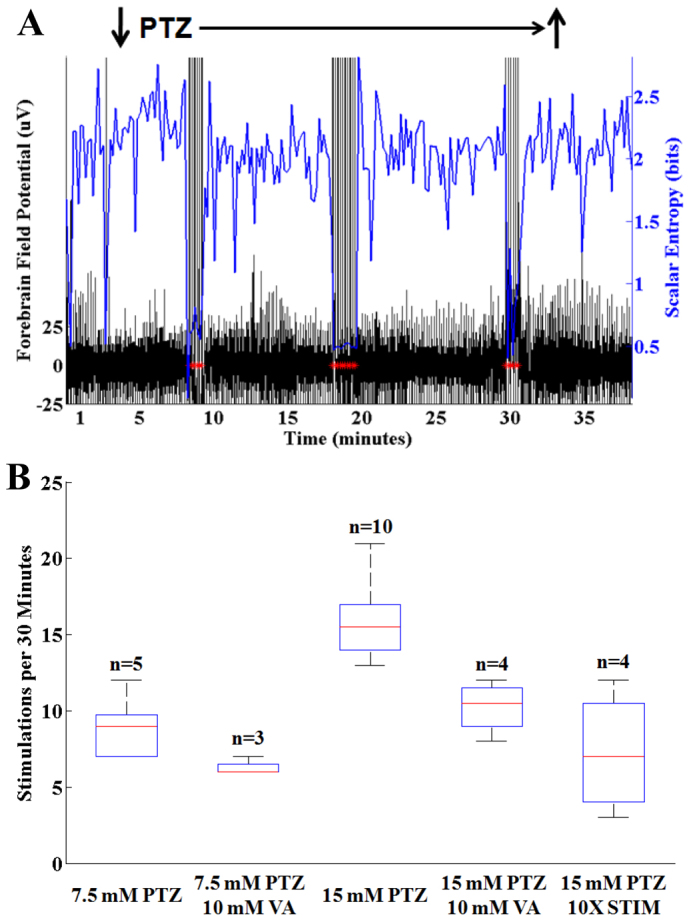
Fig. 4.

Reactive hindbrain stimulation in the presence of PTZ. (A) Simultaneous recording of forebrain field potential (black) and scalar entropy (blue). PTZ was applied continuously (down arrow). Following a latency, there was a decrease in scalar entropy that results in a volley of hindbrain stimulations (red asterisks). A total of three stimulation volleys with 21 total hindbrain stimulations occurred over a 30-minute interval. Despite more than 30 minutes of exposure to PTZ, no seizure occurred. The amplifier registered a stimulation artifact in the EEG tracing with each stimulation. (B) Histogram showing number of stimulations per 30-minute PTZ exposure time. The stimulation rate was directly dependent on PTZ concentration and was reduced by the addition of valproic acid (VA). Use of a stimulator pulse that delivers 10× the charge per stimulation (10XSTIM) resulted in significantly fewer hindbrain stimulations over a 30-minute period in the presence of 15 mM PTZ. Bars indicate the data median. Boxes and whiskers indicate the 25th to 75th and 5th to 95th percentiles, respectively.
