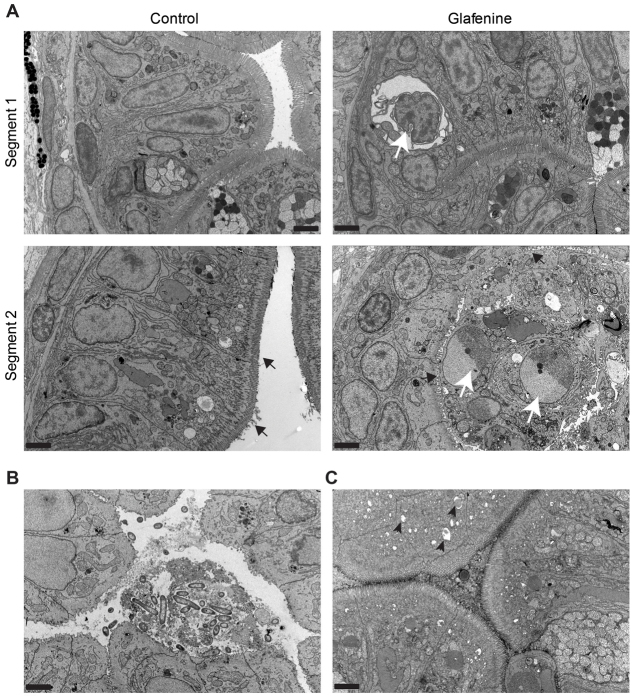
Fig. 3.
TEM identifies the apoptotic cells as intestinal epithelial in origin. (A–C) TEM images, representative of two separate fish, across multiple sections after 12 hours of glafenine exposure. 5000× magnification; scale bars: 2 μm. (A,B) Samples fixed after 12 hours of exposure. (C) Images taken after 3 hours of exposure to glafenine. (A) Ultrastructure architecture of control and glafenine-injured fish in segments 1 and 2 of the intestinal epithelium. Apoptotic IECs (white arrow in segment 1) and lumenal cellular debris (white arrows in segment 2) can be observed. Brush border is indicated by black arrows. (B) Lumenal debris seen with glafenine-induced injury in segment 1, which is consistent with microvesiculation of intestinal brush border. (C) ER stress in segment 2, with characteristic pitting marked by black arrowheads.

