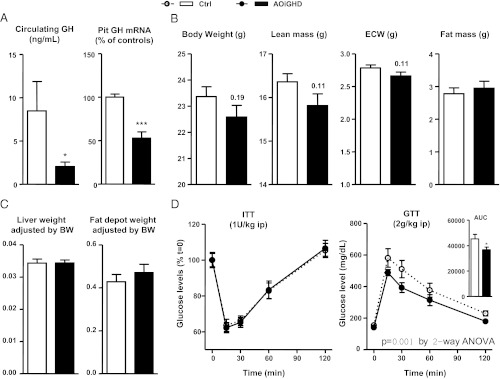
Fig. 1.
Characterization of AOiGHD females. Plasma GH levels and pituitary GH mRNA (A), body weight and body composition by NMR (lean mass, fat mass, and extracellular water) (B) and liver and adipose tissue weight (adjusted by total body weight) (C) were measured in 1-yr-old female AOiGHD and controls mice. ITTs (D, left panel) and glucose tolerance tests (GTTs) (D, right panel) were performed as described in Materials and Methods. Data represent mean ± sem of n = 15–20 mice/group. Asterisks (***, P < 0.001; *, P < 0.05) indicate values that significantly differ from controls. AUC, Area under the curve.

