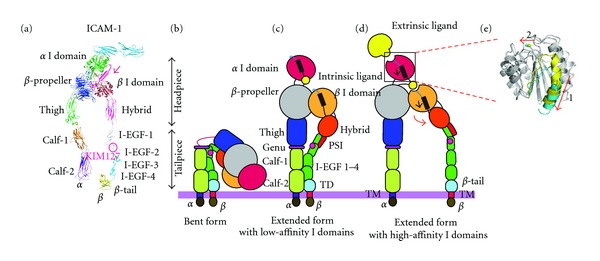
Figure 3.

Integrin structures and domains and conformational changes. (a) Integrin extracellular segment model. (b)–(e) Global conformational changes between the bent (b), intermediate (c), and extended (d) conformations. Blowups (e) showing the structures of the high- and low-affinity conformations of the alpha I domain. A piston-like downward shift of the C-terminal helix (arrow 1) is allosterically linked to the conversion of the MIDAS to the high-affinity configuration (arrow 2). Superposition of the high- (blue) and closed low- (yellow) affinity I domain is shown. Regions undergoing significant conformational changes are shaded in color, whereas regions not undergoing such changes are shaded in gray.
