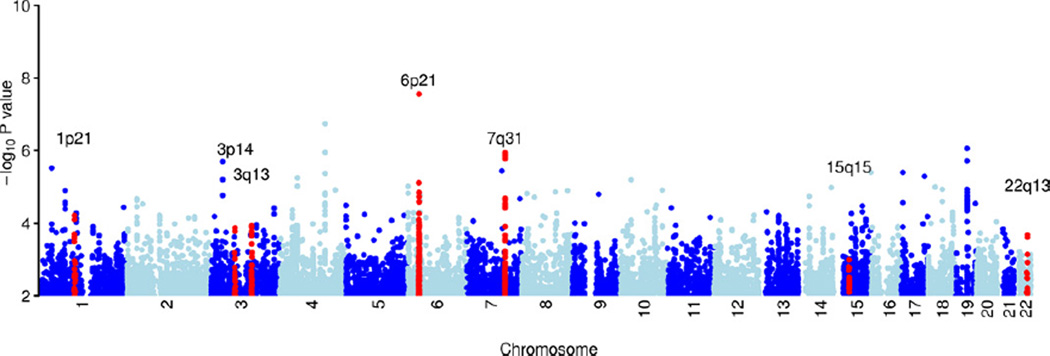
Figure 1.
Plot of genome-wide association results after fitting the multiplicative model in SNPTEST. Genome-wide association results in the discovery data at 696,957 directly genotyped single nucleotide polymorphisms, each represented as a point on the plot. Chromosomes are colored dark blue and light blue alternatively, as labeled on the x axis. The −log 10 (p value) is shown on the y axis. Loci identified in this study as being potentially associated with schizophrenia (Table 2) are highlighted in red and labeled by chromosomal region.

