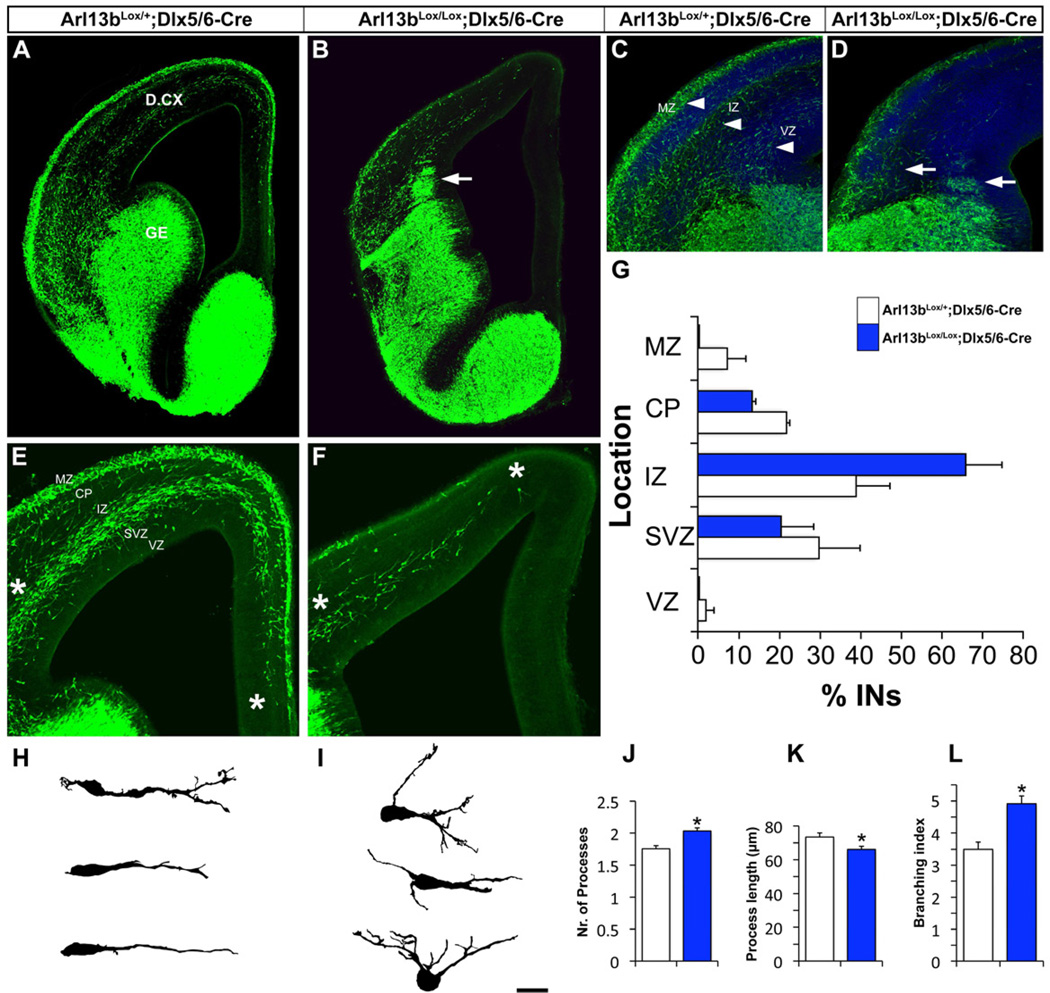
Figure 3. Arl13 deletion leads to interneuronal migration and branching defects.
(A-B) GFP-labeled coronal hemisections show interneuron migration defects in Arl13bLox/Lox;Dlx5/6-CIE mutants, with clusters of cells stuck at the pallial-subpallial boundary (arrow, 5B). (C-D) Loss of characteristic interneuronal migratory streams in Arl13bLox/Lox;Dlx5/6-CIE cortex. Arrowheads in C indicate streams of migrating interneurons in the MZ, IZ and SVZ of control cortex. Arrows in D indicate disruptions in these streams in mutant cortex. (E-F) Higher magnification images of the control (E) and mutant (F) dorsal cortex illustrating disrupted extent and patterns of migration in mutants. Left asterisks mark pallial-subpallial boundary, right asterisks mark the migration front. (G) Disrupted migration results in altered distribution of interneurons (INs) across the cortical wall in Arl13bLox/Lox;Dlx5/6-CIE cortex, with a larger percentage of cells moving through the intermediate zone (IZ) and a corresponding loss of cells in other locations. The overall number of interneurons was reduced in mutants, but mutants show a higher percentage of interneurons in the IZ than controls. (H, I) Camera lucida drawings of sample control (H) and mutant (I) interneurons in the dorsal cortex. (J-L) Quantification of branching defects in Arl13b-deficient interneurons. (J) Number of processes extending from cell soma. (K) Total process length (n=506 cells each from control and mutants). (L) Branching index (average number of branching events in a migrating interneuron per hour). Data shown are mean ± SEM; * indicates significant when compared with controls at p<0.05; ** indicates significant when compared with controls at p<0.01 (Student’s t test). VZ-ventricular zone, SVZ-subventricular zone, IZ-intermediate zone, CP-cortical plate, GE-ganglionic eminence, D.CX-dorsal cortex. Scale bar= A-D, 675µm; E-F, 225µm; G-H, 100µm; J-K, 25µm.

