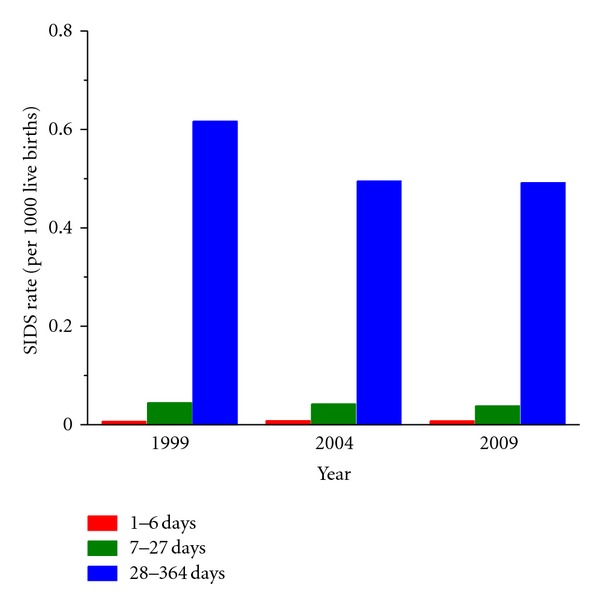
Figure 3.

Rate of SIDS, expressed as the number of SIDS cases per 1,000 live births, occurring during week 1 of the infant's life (days 1–6, red bars), during weeks 2–4 (days 7–27, green bars), and during week 5 and later (days 28–364, blue bars) in the United States in 1999, 2004, and 2009. Data from the Compressed Mortality database as provided on the Wide-ranging Online Data for Epidemiologic Research (WONDER) website of the Centers for Disease Control and Prevention (CDC, http://wonder.cdc.gov/mortSQL.html).
