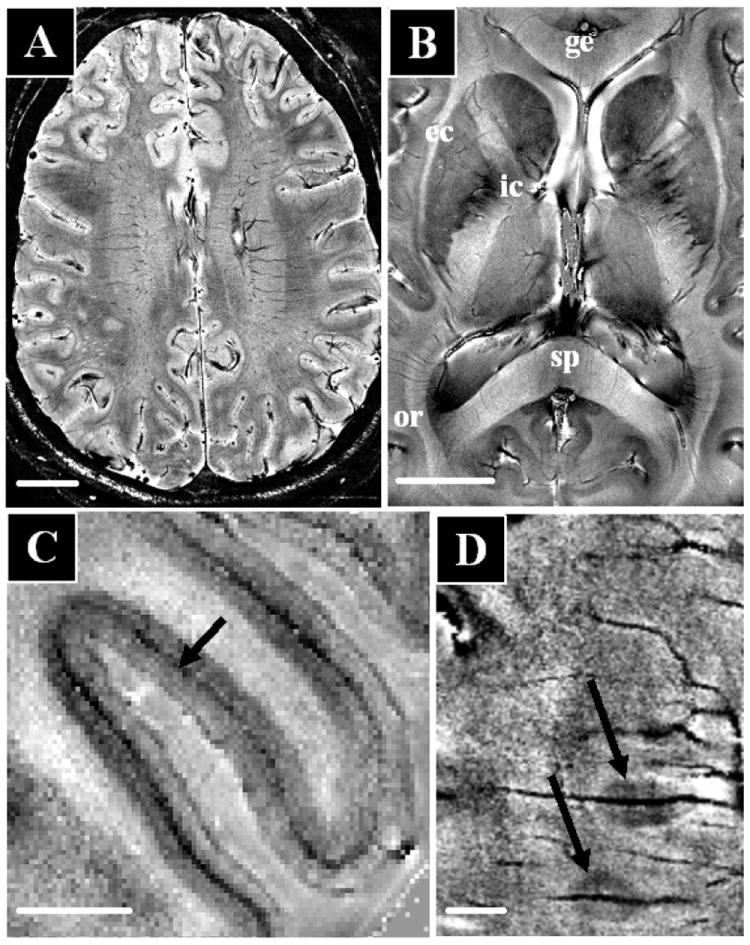
Figure 2.

High resolution in-vivo human brain anatomy using multi-channel detectors at 7.0 T and susceptibility contrast using signal magnitude (A) and phase (C-D) at 25-50 nl resolution An axial brain slice (A, scale bar 20 mm) shows strong contrast variation throughout the image. Substantial contrast variations are also seen in the major fiber bundles (B, scale bar 20 mm) including the internal and external capsule (ic, ec), the genu and splenium of the corpus callosum (ge, sp), and the optic radiation (or). Within the visual cortex (C, scalebar 5 mm) intracortical detail allows identification of the line of Gennari (darkening in central layer). In MS (D, scalebar 5 mm), signal phase allow high resolution imaging of small peri-vascular lesions (image courtesy of Francesca Bagnato and Henry McFarland, NIH).
