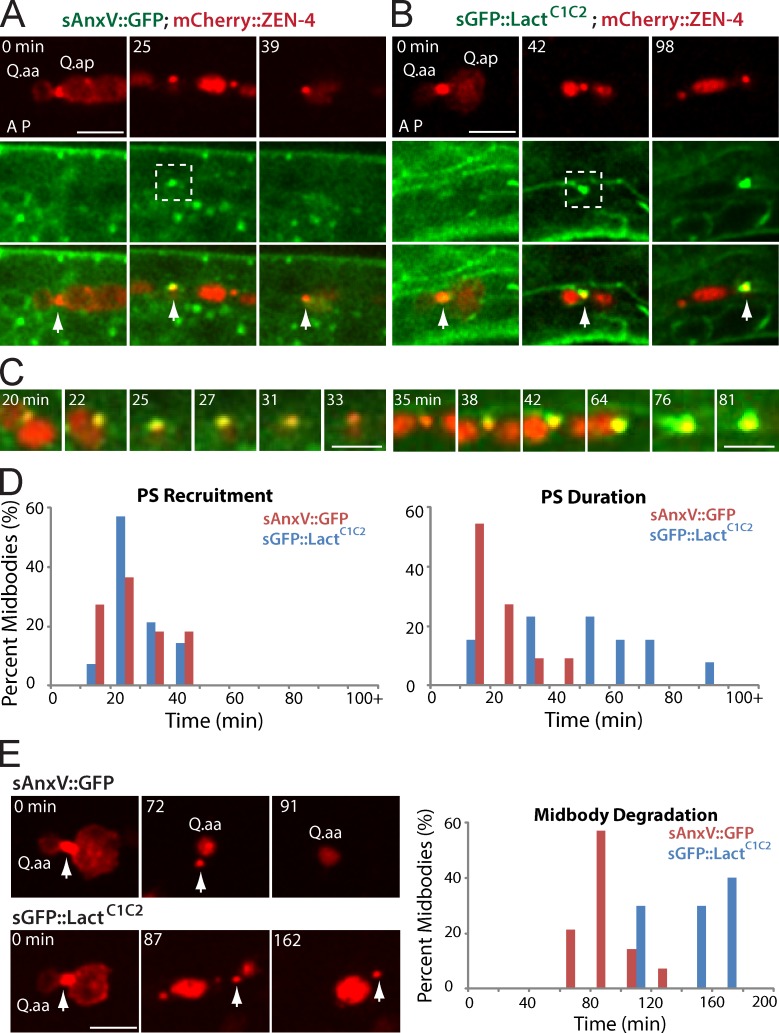
Figure 3.
The recruitment and effect of PS markers to the Q cell midbody. (A and B) Still images of sAnxV::GFP (A) and sGFP::LactC1C2 (B) on the Q cell midbody. mCherry labels the Q cell midbody/ZEN-4 (top), and GFP marks PS (middle). Arrows show the midbody. A, anterior; P, posterior. (C) Enlarged time-lapse views of the dotted boxes (left, 25 min; right, 80 min) in which sAnxV::GFP or sGFP::LactC1C2 was recruited onto the midbody. (D and E) Quantifications of the time for PS recruitment (D) and duration (E) on the Q cell midbody. n = 10–15 from a single experiment. (E) Still images (left) show midbody degradation in the presence of sAnxV::GFP (top) or sGFP::LactC1C2 (bottom). sGFP::LactC1C2 overexpression caused a delay of midbody degradation. Arrows show the midbody. Quantifications are given on the right. Statistic analysis is shown in Fig. S3. Bars: (A and B) 5 µm; (C) 2.5 µm.

