Fig. 5.
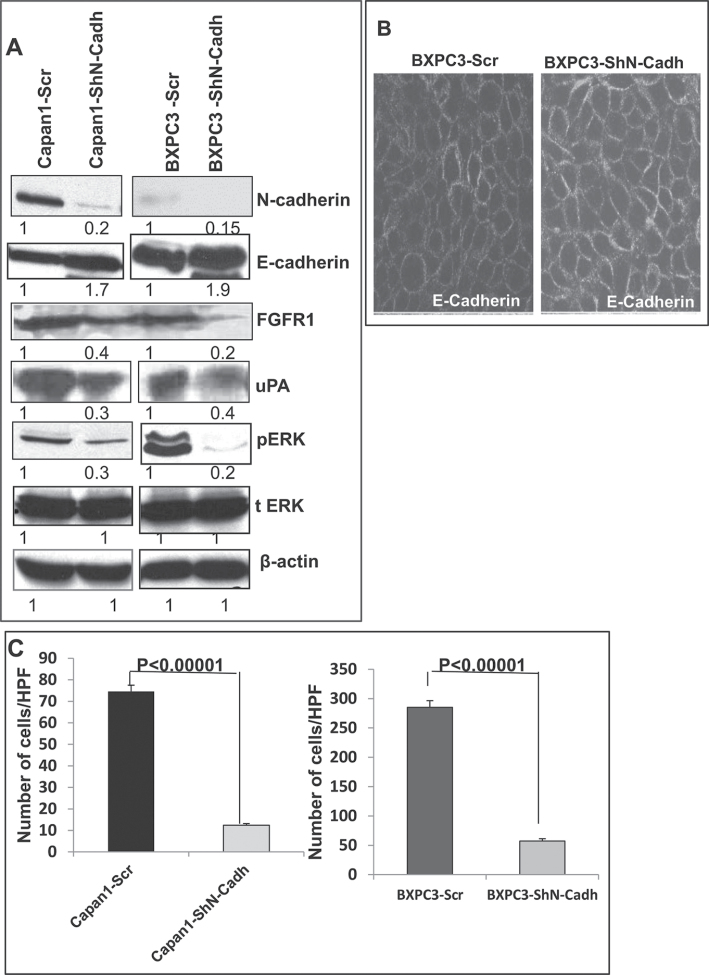
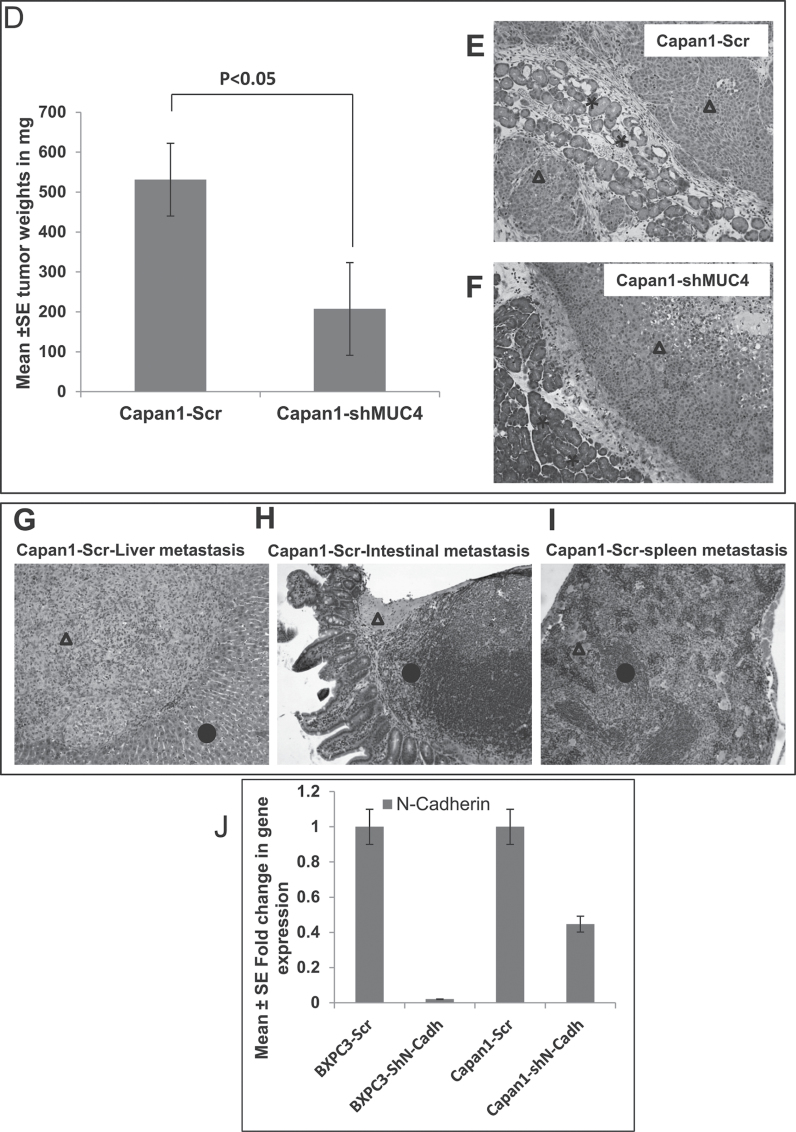
N-cadherin mediated stabilization of FGFR1. (A) Western blot analysis showed that significant upregulation of E-cadherin, downregulation of FGFR1, uPA, pERK1/2, in N-cadherin knockdown Capan1/BxPC3 cells as compared with vector controls (Capan1/BxPC3-scr/ShN-cadherin). The total form of ERK1/2 remains unchanged. β-actin was used as a loading control. (B) Confocal microscopy shows increased staining for E-cadherin in N-cadherin knockdown BxPC3-cells and diminished staining in BxPC3-Scr vector cells (scale bar 20 µm) (FITC-conjugated goat anti-mouse IgG for secondary antibody and DAPI was used for nuclear staining). (C). Capan1 and BxPC3 cells (1×10⁶) were seeded on noncoated or matrigel-coated membranes for motility incubated for 24h. The lower chamber was filled with DMEM medium containing 10% fetal bovine serum used as a chemo attractant. The cells that migrate through trans-well membrane were fixed, stained and photographed for 10 random fields under bright-field microscopy (Magnification X10). The decreased motility and invasion were observed in N-cadherin knockdown Capan1/BxPC3 cells compared to scramble controls (***P < 0.00001 and ***P < 0.00001). (D) Effect of oncogenic MUC4 knockdown on size of orthotopically grown primary tumors. The mean weight of tumors formed by Capan1-shMUC4 cells was significantly less than that formed by the scrambled cells (P < 0.05). (E and F) are the hemotoxalin and eosin staining of primary tumors and (G–I) metastatic lesions from liver, intestine and spleen. (Δ indicates tumor, * indicates normal tissue). (J) Real-time PCR analysis using primers that specifically amplify the N-cadherin gene showed reduced expression N-cadherin in N-cadherin knockdown Capan1and BxPC3 cells.


