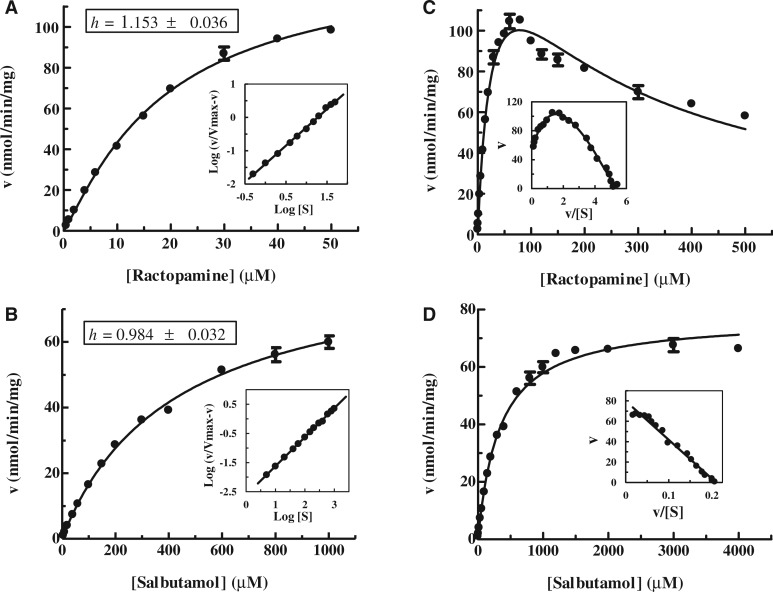
Fig. 4.
Kinetic analysis for the sulfation of ractopamine and salbutamol by human SULT1A3. (A) and (B) The hyperbolic curve analyses of the sulfation of ractopamine and salbutamol. The fitting curves were generated using sigmoidal program and the Hill coefficients (h) were determined by Hill equation. Hill plots are inserted under each fitting curve. (C) and (D) The saturation curve analyses of the sulfation of ractopamine and salbutamol. The fitting curves were generated using substrate inhibition (C) and Michaelis–Menten kinetics (D). Eadie–Hofstee plots are inserted under each fitting curve. Data shown represent calculated mean ± standard deviation derived three experiments.

