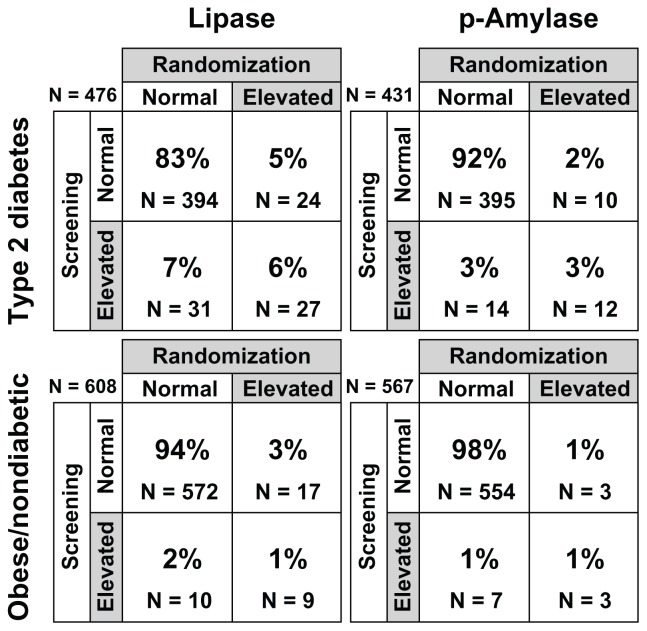
Figure 3.
Categorical designations, ie, normal (≤ULN) or elevated (>ULN), indicating percentages of subjects with no change, change from elevated to normal, or change from normal to elevated from screening to baseline.
Note: Number (N) of subjects included in this analysis was based on the number of subjects with available data at screening and baseline.
Note: Percentages may not add to 100% due to rounding.
Abbreviations: ULN, upper limit of normal; p-Amylase, pancreatic amylase.

