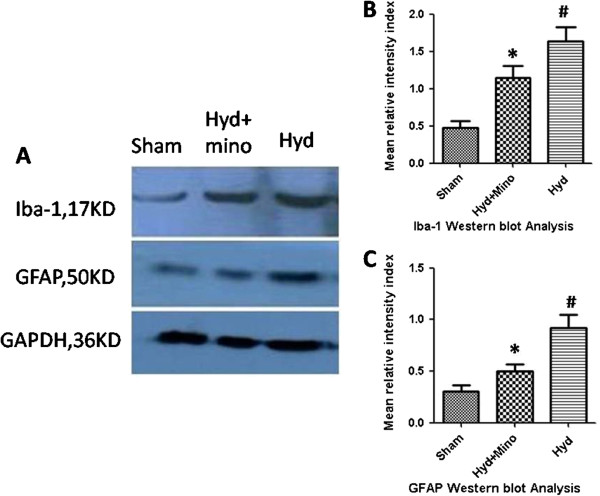
Figure 5.

Proteins were processed for Western blot to assess levels of GFAP and Iba-1(A). Mean ranking score of GFAP(B) and Iba-1(C) in brain tissue for Sham Control group(n=10), Hydrocephalic with minocycline group(n=9) and Hydrocephalic no minocycline group(n=9) were analysed. The Hydrocephalic no minocycline group expressed levels significantly(P<0.01) increased of GFAP and Iba-1 protein when compared with Sham control animals (#). The GFAP and Iba-1 expression of Hydrocephalic with minocycline group are lower(P<0.05) than that of no minocycline group(*)
