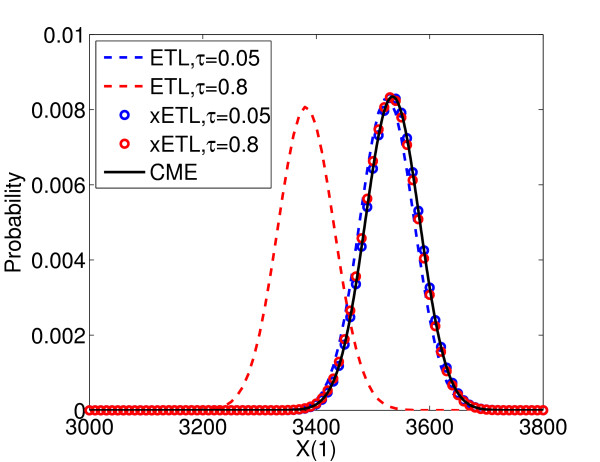
Figure 2.
Constructing full extrapolated distributions of System 1. Distribution of states at time T = 10.4 for ETL with τ = 0.05 (blue dashes), ETL with τ = 0.8 (red dashes), xETL with τ = 0.05 (red circles), xETL with τ = 0.8 (blue circles). The analytical solution is given by the CME (black line). The extrapolated distributions match the CME solution very closely.

