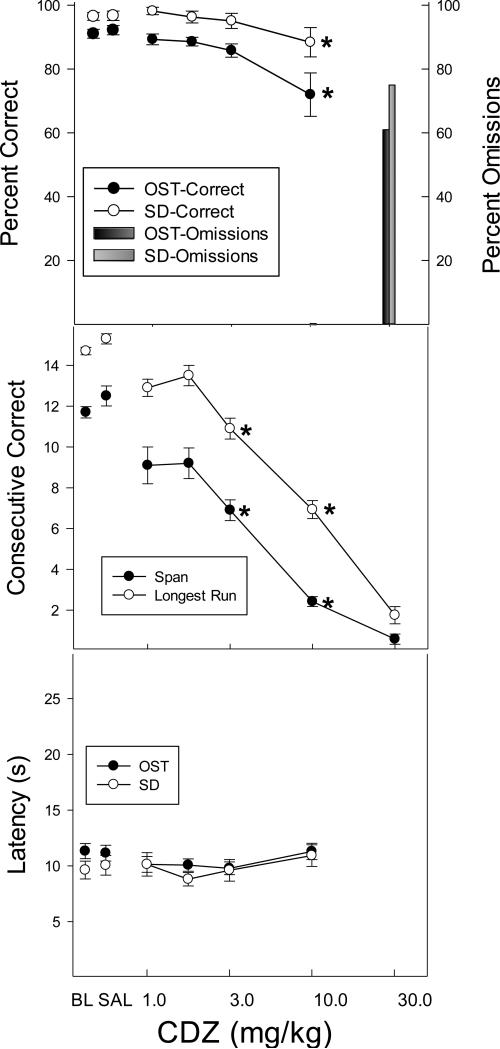
Figure 4.
Top panel shows the effects of CDZ on percent correct (circles) and omissions (bars) for the OST (black circles; dark bars) and the SD (white circles; light bars). Middle panel shows span (black circles) and longest run (white circles) and the bottom panel shows latency to the first response for the OST (black) and the SD (white). Vertical lines indicate SEM and stars indicate conditions that differed significantly from saline control.

