
Figure 4.
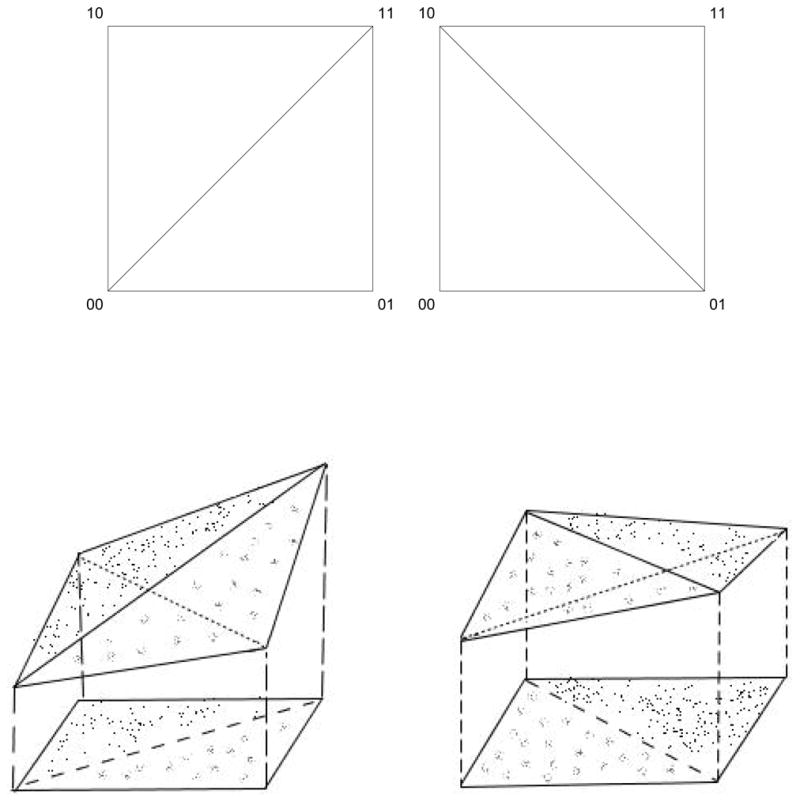
The upper pictures shows the triangulations of the genotopes (the squares) in Case 1 and 2, corresponding to positive and negative epistasis. The lower left picture shows the tetrahedron above the genotope in Case 1, where the height coordinates correspond to the fitness of the four genotypes under consideration. The projections of the upper sides of the tetrahedron describe the triangulations. The lower right picture shows how the triangulation is induced in Case 2.